Concept explainers
Videos
To Find: The approximate orientation of the lower leg when the ankle moves at minimum speed.
Answer to Problem 1Q
Lower leg is vertically oriented when the ankle moves at minimum speed.
Explanation of Solution
Introduction:
Speed: speed can be defined as distance travelled by an object per unit time. SI unit of speed is
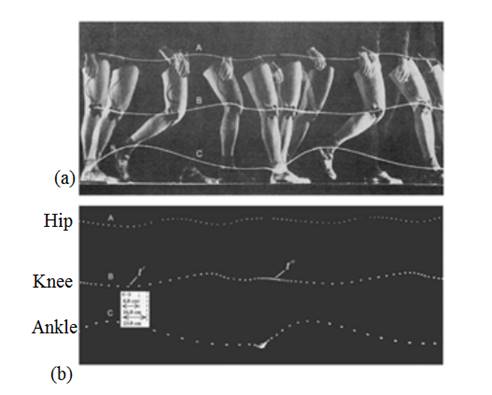
In the given figure, (a) represent the motion of different parts of leg while (b) represents the instantaneous motion of the corresponding parts.
Farther the dots, maximum will be the speed whilecloser the dots minimum will be the speed.
It is very clear from figure (b), that minimum speed is where the distance between dots are almost negligible. Corresponding to this the orientation of the lower leg is almost vertical.
Conclusion:
Orientation of lower leg is almost vertical, during the minimum speed of the ankle.
Want to see more full solutions like this?
Chapter 1 Solutions
Physics Fundamentals


- An electromagnetic wave is traveling through vacuum in the positive x direction. Its electric field vector is given by E=E0sin(kx−ωt)j^,where j^ is the unit vector in the y direction. If B0 is the amplitude of the magnetic field vector, find the complete expression for the magnetic field vector B→ of the wave. What is the Poynting vector S(x,t), that is, the power per unit area associated with the electromagnetic wave described in the problem introduction? Give your answer in terms of some or all of the variables E0, B0, k, x, ω, t, and μ0. Specify the direction of the Poynting vector using the unit vectors i^, j^, and k^ as appropriate. Please explain all stepsarrow_forwardAnother worker is performing a task with an RWL of only 9 kg and is lifting 18 kg, giving him an LI of 2.0 (high risk). Questions:What is the primary issue according to NIOSH?Name two factors of the RWL that could be improved to reduce risk.If the horizontal distance is reduced from 50 cm to 30 cm, how does the HM change and what effect would it have?arrow_forwardTwo complex values are z1=8 + 8i, z2=15 + 7 i. z1∗ and z2∗ are the complex conjugate values. Any complex value can be expessed in the form of a+bi=reiθ. Find r and θ for z1z2∗. Find r and θ for z1/z2∗? Find r and θ for (z1−z2)∗/z1+z2∗. Find r and θ for (z1−z2)∗/z1z2∗ Please explain all steps, Thank youarrow_forward
- An ac series circuit consists of a voltage source of frequency 60 Hz and voltage amplitude V, a 505-Ω resistor, and a capacitor of capacitance 7.2 μF. What must be the source voltage amplitude V for the average electrical power consumed in the resistor to be 236 W? There is no inductance in the circuit.arrow_forwardAn L−R−C series circuit has R= 280 Ω . At the frequency of the source, the inductor has reactance XLL= 905 Ω and the capacitor has reactance XC= 485 Ω . The amplitude of the voltage across the inductor is 445 V . What is the amplitude of the voltage across the resistor and the capacitor? What is the voltage amplitude of the source? What is the rate at which the source is delivering electrical energy to the circuit?arrow_forwardA 0.185 H inductor is connected in series with a 98.5 Ω resistor and an ac source. The voltage across the inductor is vL=−(12.5V)sin[(476rad/s)t]vL. Derive an expression for the voltage vR across the resistor. Express your answer in terms of the variables L, R, VL (amplitude of the voltage across the inductor), ω, and t. What is vR at 2.13 ms ? Please explain all stepsarrow_forward
- A worker lifts a box under the following conditions:Horizontal distance (H): 30 cmInitial height (V): 60 cmVertical travel (D): 50 cmTorso rotation (A): 30°Frequency: 3 times/minute for 1 hourGrip: Good Question:What is the RWL for this task?What does this value mean in terms of occupational safety?arrow_forwardCan someone helparrow_forwardCan someone help mearrow_forward
- 3. Four identical small masses are connected in a flat perfect square. Rank the relative rotational inertias (IA, IB, IC) about the three axes of rotation shown. Axes A and B are in the plane of the square, and axis C is perpendicular to the plane, through mass m1. ΙΑ IB m2 m1 m3 Ic m4 (a) IAarrow_forwardConsider the circuit shown in the figure below. (Assume L = 5.20 m and R2 = 440 Ω.) (a) When the switch is in position a, for what value of R1 will the circuit have a time constant of 15.4 µs? (b) What is the current in the inductor at the instant the switch is thrown to position b?arrow_forwardCan someone helparrow_forwardarrow_back_iosSEE MORE QUESTIONSarrow_forward_ios
 Classical Dynamics of Particles and SystemsPhysicsISBN:9780534408961Author:Stephen T. Thornton, Jerry B. MarionPublisher:Cengage Learning
 Glencoe Physics: Principles and Problems, Student...PhysicsISBN:9780078807213Author:Paul W. ZitzewitzPublisher:Glencoe/McGraw-Hill
 Physics for Scientists and Engineers, Technology ...PhysicsISBN:9781305116399Author:Raymond A. Serway, John W. JewettPublisher:Cengage Learning
 An Introduction to Physical SciencePhysicsISBN:9781305079137Author:James Shipman, Jerry D. Wilson, Charles A. Higgins, Omar TorresPublisher:Cengage Learning
 Principles of Physics: A Calculus-Based TextPhysicsISBN:9781133104261Author:Raymond A. Serway, John W. JewettPublisher:Cengage Learning
 University Physics Volume 1PhysicsISBN:9781938168277Author:William Moebs, Samuel J. Ling, Jeff SannyPublisher:OpenStax - Rice University