
Videos
PERFORMANCE LAWN EQUIPMENT
In each chapter of this book, we use a fictitious company, Performance Lawn Equipment (PLE), within a case exercise for applying the tools and techniques introduced in the chapter.31 To put the case in perspective, we first provide some background about the company, so that the applications of business analytic tools will be more meaningful.
PLE, headquartered in St. Louis, Missouri, is a privately owned designer and producer of traditional lawn mowers used by homeowners. In the past ten years, PLE has added another key product, a medium-size diesel power lawn tractor with front and rear power takeoffs, Class I three-point hitches, four-wheel drive, power steering, and full hydraulics. This equipment is built primarily for a niche market consisting of large estates, including golf and country clubs, resorts, private estates, city parks, large commercial complexes, lawn care service providers, private homeowners with five or more acres, and government (federal, state, and local) parks, building complexes, and military bases. PLE provides most of the products to dealerships, which, in turn, sell directly to end users. PLE employs 1,660 people worldwide. About half the workforce is based in St. Louis; the remainder is split among their manufacturing plants.
In the United States, the focus of sales is on the eastern seaboard, California, the Southeast, and the south central states, which have the greatest concentration of customers. Outside the United States, PLE’s sales include a European market, a growing South American market, and developing markets in the Pacific Rim and China.
Both end users and dealers have been established as important customers for PLE. Collection and analysis of end-user data showed that satisfaction with the products depends on high quality, easy attachment/dismount of implements, low maintenance, price value, and service. For dealers, key requirements are high quality, parts and feature availability, rapid restock, discounts, and timeliness of support.
PLE has several key suppliers: Mitsitsiu, Inc., the sole source of all diesel engines; LANTO Axles, Inc., which provides tractor axles; Schorst Fabrication, which provides subassemblies; Cuberillo, Inc, supplier of transmissions; and Specialty Machining, Inc., a supplier of precision machine parts.
To help manage the company, PLE managers have developed a “balanced scorecard” of measures. These data, which are summarized shortly, are stored in the form of a Microsoft Excel workbook (Performance Lawn Equipment) accompanying this book. The database contains various measures captured on a monthly or quarterly basis and is used by various managers to evaluate business performance. Data for each of the key measures are stored in a separate worksheet. A summary of these worksheets is given next:
- Dealer Satisfaction, measured on a scale of 1–5 (1 = poor, 2 = less than average, 3 = average, 4 = above average, and 5 = excellent). Each year, dealers in each region are surveyed about their overall satisfaction with PLE. The worksheet contains summary data from surveys for the past five years.
- End-User Satisfaction, measured on the same scale as dealers. Each year, 100 users from each region are surveyed. The worksheet contains summary data for the past five years.
- Customer Survey, results from a survey for customer ratings of specific attributes of PLE tractors: quality, ease of use, price, and service on the same 1–5 scale. This sheet contains 200 observations of customer ratings. Complaints, which shows the number of complaints registered by all customers each month in each of PLE’s five regions (North America, South America, Europe, the Pacific, and China).
- Mower Unit Sales and Tractor Unit Sales, which provide sales by product by region on a monthly basis. Unit sales for each region are aggregated to obtain world sales figures.
- Industry Mower Total Sales and Industry Tractor Total Sales, which list the number of units sold by all producers by region.
- Unit Production Costs, which provides monthly accounting estimates of the variable cost per unit for manufacturing tractors and mowers over the past five years.
- Operating and Interest Expenses, which provides monthly administrative, depreciation, and interest expenses at the corporate level.
- On-Time Delivery, which provides the number of deliveries made each month from each of PLE’s major suppliers, the number on time, and the percent on time.
- Defects After Delivery, which shows the number of defects in supplier-provided material found in all shipments received from suppliers.
- Time to Pay Suppliers, which provides measurements in days from the time the invoice is received until payment is sent.
- Response Time, which gives samples of the times taken by PLE customer-service personnel to respond to service calls by quarter over the past two years.
- Employee Satisfaction, which provides data for the past four years of internal surveys of employees to determine their overall satisfaction with their jobs, using the same scale used for customers. Employees are surveyed quarterly, and results are stratified by employee category: design and production, managerial, and sales/administrative support.
In addition to these business measures, the PLE database contains worksheets with data from special studies:
- Engines, which lists 50 samples of the time required to produce a lawn mower blade using a new technology.
- Transmission Costs, which provides the results of 30 samples each for the current process used to produce tractor transmissions and two proposed new processes.
- Blade Weight, which provides samples of mower blade weights to evaluate the consistency of the production process.
- Mower Test, which lists test results of mower
functional performance after assembly for 30 samples of 100 units each. - Employee Retention, data from a study of employee duration (length of hire) with PLE. The 40 subjects were identified by reviewing hires from ten years prior and identifying those who were involved in managerial positions (either hired into management or promoted into management) at some time in this ten year period.
- Shipping Cost, which gives the unit shipping cost for mowers and tractors from existing and proposed plants for a supply chain design study.
- Fixed Cost, which lists the fixed cost to expand existing plants or build new facilities, also as part of the supply chain design study.
- Purchasing Survey, which provides data obtained from a third-party survey of purchasing managers of customers of Performance Lawn Care.
Elizabeth Burke has recently joined the PLE management team to oversee production operations. She has reviewed the types of data that the company collects and has assigned you the responsibility to be her chief analyst in the coming weeks. She has asked you to do some preliminary analysis of the data for the company.
- 1. First, she would like you to edit the worksheets Dealer Satisfaction and End-User Satisfaction to display the total number of responses to each level of the survey scale across all regions for each year.
- 2. Second, she wants a count of the number of failures in the worksheet Mower Test.
- 3. Next, Elizabeth has provided you with prices for PLE products for the past five years:
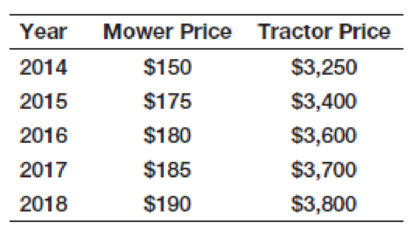
Create a new worksheet to compute gross revenues by month and region, as well as worldwide totals, for each product using the data in Mower Unit Sales and Tractor Unit Sales.
- 4. Finally, she wants to know the market share for each product and region by month based on the PLE and industry sales data, and the average market share by region over the five years.
Summarize all your findings in a report to Ms. Burke.
Want to see the full answer?
Check out a sample textbook solution
Chapter 1 Solutions
Business Analytics


- A researcher wishes to estimate, with 90% confidence, the population proportion of adults who support labeling legislation for genetically modified organisms (GMOs). Her estimate must be accurate within 4% of the true proportion. (a) No preliminary estimate is available. Find the minimum sample size needed. (b) Find the minimum sample size needed, using a prior study that found that 65% of the respondents said they support labeling legislation for GMOs. (c) Compare the results from parts (a) and (b). ... (a) What is the minimum sample size needed assuming that no prior information is available? n = (Round up to the nearest whole number as needed.)arrow_forwardThe table available below shows the costs per mile (in cents) for a sample of automobiles. At a = 0.05, can you conclude that at least one mean cost per mile is different from the others? Click on the icon to view the data table. Let Hss, HMS, HLS, Hsuv and Hмy represent the mean costs per mile for small sedans, medium sedans, large sedans, SUV 4WDs, and minivans respectively. What are the hypotheses for this test? OA. Ho: Not all the means are equal. Ha Hss HMS HLS HSUV HMV B. Ho Hss HMS HLS HSUV = μMV Ha: Hss *HMS *HLS*HSUV * HMV C. Ho Hss HMS HLS HSUV =μMV = = H: Not all the means are equal. D. Ho Hss HMS HLS HSUV HMV Ha Hss HMS HLS =HSUV = HMVarrow_forwardQuestion: A company launches two different marketing campaigns to promote the same product in two different regions. After one month, the company collects the sales data (in units sold) from both regions to compare the effectiveness of the campaigns. The company wants to determine whether there is a significant difference in the mean sales between the two regions. Perform a two sample T-test You can provide your answer by inserting a text box and the answer must include: Null hypothesis, Alternative hypothesis, Show answer (output table/summary table), and Conclusion based on the P value. (2 points = 0.5 x 4 Answers) Each of these is worth 0.5 points. However, showing the calculation is must. If calculation is missing, the whole answer won't get any credit.arrow_forward
- Binomial Prob. Question: A new teaching method claims to improve student engagement. A survey reveals that 60% of students find this method engaging. If 15 students are randomly selected, what is the probability that: a) Exactly 9 students find the method engaging?b) At least 7 students find the method engaging? (2 points = 1 x 2 answers) Provide answers in the yellow cellsarrow_forwardIn a survey of 2273 adults, 739 say they believe in UFOS. Construct a 95% confidence interval for the population proportion of adults who believe in UFOs. A 95% confidence interval for the population proportion is ( ☐, ☐ ). (Round to three decimal places as needed.)arrow_forwardFind the minimum sample size n needed to estimate μ for the given values of c, σ, and E. C=0.98, σ 6.7, and E = 2 Assume that a preliminary sample has at least 30 members. n = (Round up to the nearest whole number.)arrow_forward
- In a survey of 2193 adults in a recent year, 1233 say they have made a New Year's resolution. Construct 90% and 95% confidence intervals for the population proportion. Interpret the results and compare the widths of the confidence intervals. The 90% confidence interval for the population proportion p is (Round to three decimal places as needed.) J.D) .arrow_forwardLet p be the population proportion for the following condition. Find the point estimates for p and q. In a survey of 1143 adults from country A, 317 said that they were not confident that the food they eat in country A is safe. The point estimate for p, p, is (Round to three decimal places as needed.) ...arrow_forward(c) Because logistic regression predicts probabilities of outcomes, observations used to build a logistic regression model need not be independent. A. false: all observations must be independent B. true C. false: only observations with the same outcome need to be independent I ANSWERED: A. false: all observations must be independent. (This was marked wrong but I have no idea why. Isn't this a basic assumption of logistic regression)arrow_forward
- Business discussarrow_forwardSpam filters are built on principles similar to those used in logistic regression. We fit a probability that each message is spam or not spam. We have several variables for each email. Here are a few: to_multiple=1 if there are multiple recipients, winner=1 if the word 'winner' appears in the subject line, format=1 if the email is poorly formatted, re_subj=1 if "re" appears in the subject line. A logistic model was fit to a dataset with the following output: Estimate SE Z Pr(>|Z|) (Intercept) -0.8161 0.086 -9.4895 0 to_multiple -2.5651 0.3052 -8.4047 0 winner 1.5801 0.3156 5.0067 0 format -0.1528 0.1136 -1.3451 0.1786 re_subj -2.8401 0.363 -7.824 0 (a) Write down the model using the coefficients from the model fit.log_odds(spam) = -0.8161 + -2.5651 + to_multiple + 1.5801 winner + -0.1528 format + -2.8401 re_subj(b) Suppose we have an observation where to_multiple=0, winner=1, format=0, and re_subj=0. What is the predicted probability that this message is spam?…arrow_forwardConsider an event X comprised of three outcomes whose probabilities are 9/18, 1/18,and 6/18. Compute the probability of the complement of the event. Question content area bottom Part 1 A.1/2 B.2/18 C.16/18 D.16/3arrow_forward
 Big Ideas Math A Bridge To Success Algebra 1: Stu...AlgebraISBN:9781680331141Author:HOUGHTON MIFFLIN HARCOURTPublisher:Houghton Mifflin Harcourt