
Videos
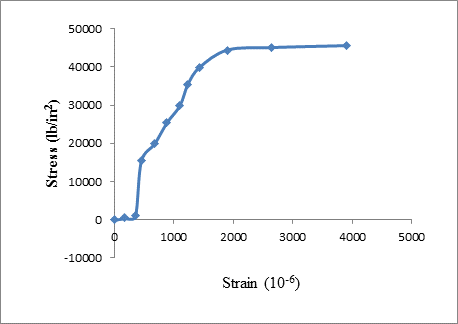
The results of a tensile test are shown in Table 1.5.2. The test was performed on a metal specimen with a circular cross section. The diameter was
a. Use the data in Table 1.5.2 to produce a table of stress and strain values.
b. Plot the stress-strain data and draw a best-fit curve.
c. Compute the, modulus of elasticity from the initial slope of the curve.
d. Estimate the yield stress.

Trending nowThis is a popular solution!

Chapter 1 Solutions
Steel Design (Activate Learning with these NEW titles from Engineering!)
Additional Engineering Textbook Solutions
Vector Mechanics For Engineers
Concepts Of Programming Languages
Modern Database Management
Automotive Technology: Principles, Diagnosis, And Service (6th Edition) (halderman Automotive Series)
HEAT+MASS TRANSFER:FUND.+APPL.


- Given cross-classification data for the Jeffersonville Transportation Study Area in this table, develop the family of cross-classification curves. (Use high = $55,000; medium = $25,000; low = $15,000. Submit a file with a maximum size of 1 MB.) Choose File No file chosen This answer has not been graded yet. Determine the number of trips produced (by purpose) for a traffic zone containing 400 houses with an average household income of $35,000. HBW 2200 HBO Your response differs from the correct answer by more than 10%. Double check your calculations. trips 2747 NHB Your response differs from the correct answer by more than 10%. Double check your calculations. trips 2507 Your response differs from the correct answer by more than 10%. Double check your calculations. tripsarrow_forwardI am studying building diagnosis. Kindly help to provide the answers and example required and elaborate for explanation.arrow_forwardA simply supported rectangular RC beam is to carry a uniform factored dead load of 1.2 kip/ftand a concentrated factored live load of 16 kip at mid-span. The beam self-weight is not includedin these loads. The concrete weighs 135 pcf. The span length is 25 ft. Please find the smallestsection allowed by ACI and design accordingly. Use f c’ = 5,000 psi, f y = 75,000 psi. Theexposure is interior with no weather exposure.a. Assume an arbitrary self-weight/ft of the beam.b. Find the maximum factored bending moment in the beam.c. Set up the moment equation and solve for the beam section.d. Revise the assumption if needed.Hint: The beam section (b and h) and steel reinforcement are inversely proportional. The smallestallowable beam section will be for the largest allowable steel ration (ρmax), and vice versa. Sincethe steel ratio is fixed, two remaining variables (b, d) need to be found from the moment equations.Then, bd2 term can be solved to get an acceptable b and d combination.arrow_forward
- Find: ftop and fbottom of (initial stage, construction phase, final stage)arrow_forward+150+ Assignment SW+ SLAB SDL = 250 150 - 3.3 kPa укра LL = 3 kPa 3 ୪ 8c = 23.6 kN/m² P = 3000 KN loss, = 9% Coss = 20% LBEAM = 9m COMPUTE AND DRAW THE STESS DIAGRAM (TRIBUTARY WIDTH= 600m 350mm FIND: f TOP & BOTTOM fe = 35Mpa 100mm f'c = 42.5 MPa 218 5m) EC = 4700 √ fc (MPa) (Initial, Const. phase, final stage)arrow_forwardDesign a cantilevered rectangular RC beam subjected to a maximum factored load bending moment, M u = 260 kip-ft. The clear height requirements for the building limits the total beam depth to 22 in. Determine the beam width and the steel design. Use f c’ = 6,000 psi, f y = 40,000 psi. The grade beam is cast against earth and permanently in contact with soil. a. Assume an initial steel ratio or beam width. b. Set up the bending design equation. c. Solve for either the steel ratio or the beam width. d. Design needed steel. 2 Hint: Knowing “h”, one can estimate the “d” value. So, two remaining variables can be estimated. There are many acceptable solutions. You can either assume a steel ration and solve for width “b”, or assume a beam width “b” and solve for the steel ratio. Remember that a good beam aspect ratio (d/b) is approximately 2.0arrow_forward
- A 15 in. x 26 in. rectangular RC beam (shown in figure below) supports a service uniform dead load of 1.3 kip/ft and a service uniform live load of 1.6 kip/ft. The dead load includes the beam’s self-weight. Design the reinforcement required for maximum moments and show the design in sketches. Use f c ’ = 4,000 psi and f y = 60,000 psi. The beam is used in an open parking garage and is exposed to weather. a. Find factored maximum bending moments. b. Design for max. negative moment. c. Design for max. positive moment. Hint: Assume an initial beam shape (b, d), then solve for the needed reinforcements at the maximum negative and positive factored bending moments. This is like the class example.arrow_forwardA simply supported rectangular RC beam is to carry a uniform factored dead load of 1.2 kip/ftand a concentrated factored live load of 16 kip at mid-span. The beam self-weight is not includedin these loads. The concrete weighs 135 pcf. The span length is 25 ft. Please find the smallestsection allowed by ACI and design accordingly. Use f c’ = 5,000 psi, f y = 75,000 psi. Theexposure is interior with no weather exposure.a. Assume an arbitrary self-weight/ft of the beam.b. Find the maximum factored bending moment in the beam.c. Set up the moment equation and solve for the beam section.d. Revise the assumption if neededarrow_forward3k a 5 I IKLF d 25 5' S' E=29000ksi I = 400 in 4 Ex = ? Q = ?arrow_forward
- A simply supported rectangular RC beam is to carry a uniform factored dead load of 1.2 kip/ft and a concentrated factored live load of 16 kip at mid-span. The beam self-weight is not included in these loads. The concrete weighs 135 pcf. The span length is 25 ft. Please find the smallest section allowed by ACI and design accordingly. Use f c’ = 5,000 psi, f y = 75,000 psi. The exposure is interior with no weather exposure. a. Assume an arbitrary self-weight/ft of the beam. b. Find the maximum factored bending moment in the beam. c. Set up the moment equation and solve for the beam section. d. Revise the assumption if neededarrow_forwardIdeal gas Problems 3-1 The molecular weight of carbon dioxide, CO2, is 44. In an experiment the value y for CO2 was found to be 1.3. Assuming that CO2 is a perfect gas, calculate the gas constant, R, and the specific heats at constant pressure and constant volume, Cp, Cv (0.189 kJ/kg.K; 0.63kJ/kg.K; 0.819kJ/kg.K) 3-2 Oxygen, O2, at 200 bar is to be stored in a steel vessel at 20°C the capacity of the vessel is 0.04m³. Assuming that O₂ is a perfect gas, calculate the mass of oxygen that can be stored in the vessel. The vessel is protected against excessive pressure by a fusible plug which will melt if the temperature rises too high. At what temperature must the plug melt to limit the pressure in the vessel to 240bar? The molecular weight of oxygen is 32 (10.5 kg; 78.6°C) 3-3 A quantity of a certain perfect gas is compressed from an initial state of 0.085m³, 1 bar to a final state of 0.034m³, 3.9 bar. The specific heats at constant volume are 0.724 kJ/kg.K, and the specific heats at…arrow_forwardA trapezoidal combined footing 5.5 m long is to supporttwo 400 mm square columns 5 meters apart. The center ofthe columns are both 0.25m away from property lines. Theleft column carries 675 kN while the right column 825 kN.The allowable soil pressure is 126 kPa. Assume footing is0.5m thick with soil backfill 0.7m thick. Weight of concreteis 23.6 kN/m3 and of soil is 20.4 kN/m3. 1. Determine the required footing area.2. Find the width of the smaller end of the footing.3. Calculate the width of the larger end of the footing.Ans:15.01m2, 2m, 3.5m please show the solution. Answer is providedarrow_forward
 Steel Design (Activate Learning with these NEW ti...Civil EngineeringISBN:9781337094740Author:Segui, William T.Publisher:Cengage Learning
 Materials Science And Engineering PropertiesCivil EngineeringISBN:9781111988609Author:Charles GilmorePublisher:Cengage Learning
 Construction Materials, Methods and Techniques (M...Civil EngineeringISBN:9781305086272Author:William P. Spence, Eva KultermannPublisher:Cengage Learning
 Principles of Foundation Engineering (MindTap Cou...Civil EngineeringISBN:9781337705028Author:Braja M. Das, Nagaratnam SivakuganPublisher:Cengage Learning
 Engineering Fundamentals: An Introduction to Engi...Civil EngineeringISBN:9781305084766Author:Saeed MoaveniPublisher:Cengage Learning
 Fundamentals of Geotechnical Engineering (MindTap...Civil EngineeringISBN:9781305635180Author:Braja M. Das, Nagaratnam SivakuganPublisher:Cengage Learning