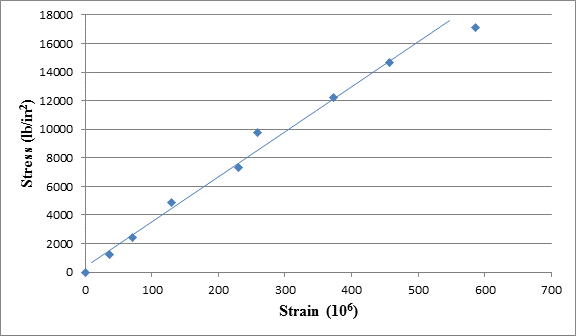
A tensile test was performed on a metal specimen having a circular cross section with a diameter 0. 510 inch. For each increment of load applied, the strain was directly determined by means of a strain gage attached to the specimen. The results are, shown in Table: 1.5.1.
a. Prepare a table of stress and strain.
b. Plot these data to obtain a stress-strain curve. Do not connect the data points; draw a best-fit straight line through them.
c. Determine the modulus of elasticity as the slope of the best-fit line.

Trending nowThis is a popular solution!

Chapter 1 Solutions
Steel Design (Activate Learning with these NEW titles from Engineering!)
Additional Engineering Textbook Solutions
Problem Solving with C++ (10th Edition)
Web Development and Design Foundations with HTML5 (8th Edition)
Mechanics of Materials (10th Edition)
Automotive Technology: Principles, Diagnosis, And Service (6th Edition) (halderman Automotive Series)
Electric Circuits. (11th Edition)
Vector Mechanics for Engineers: Statics and Dynamics
- The cantilever truss is part of vertical support system subjected to dead loads (D) and snow loads (S). The dead load is 70 psf (pound per square foot) and the snow load is 40 psf. The trusses are spaced at 20 ft apart. a) Determine the joint vertical loads PD and PS acting on joints C, D, E, F, and G. b) Determine the axial force in column JL due to dead load and due to snow load. c) Determine the force in truss member JF due to dead load and due to snow load using the method of sections. d) Using the LRFD load combinations, what it the maximum load Pu in column JL? e) Using the LRFD load combinations, what it the maximum load Pu in truss member JF?arrow_forwardneed helparrow_forward3" 17" Determine the moment of inertia and the section modulus for the steel section shown in the illustration. Show your work. 15" + k 1.5"arrow_forward
- A steel bar with a cross-sectional area of 6 in² and graded for 36 ksi is fixed to one end and subjected to an axial tensile force of 150 kips. 1) What is the stress in the bar? 2) Using ASD, determine if the cross sectional area of the bar is strong enough for the applied tensile force. (HINT: 2=1.67, the factored grade should be 36/1.67= 21.5 ksi)arrow_forwardDetermine the section modulus of a rectangle 6" wide and 9" tall. Show your work. 6" 9"arrow_forward3.140 A gate with a circular cross section is held closed by a lever 1-m long attached to a buoyant cylinder. The cylinder is 25 cm in diameter and weighs 200 N. The gate is attached to a horizontal shaft so it can pivot about its center. The liquid is water. The chain and lever attached to the gate have negligible weight. Find the length of the chain such that the gate is just on the verge of opening when the water depth above the gate hinge is 10 m. 0.25 m 10 m Pivot 1m Problem 3.140arrow_forward
- Which one of these beams would you expect to better perform under bending along the x-axis? Can you explain why? A = 14.1 in lxx 184 in 2 4 A = 8.8 in lxx 41.10 in 4 Y A = 28 in lyy = 1024 in 4arrow_forwardWhich one of these beams would you expect to better perform under bending along the x-axis? Can you explain why? A = 14.1 in lxx 184 in 2 4 A = 8.8 in lxx 41.10 in 4 Y A = 28 in lyy = 1024 in 4arrow_forwardCPP41419 - Certificate IV in Real Estate Practice (1)arrow_forward
 Steel Design (Activate Learning with these NEW ti...Civil EngineeringISBN:9781337094740Author:Segui, William T.Publisher:Cengage Learning
 Materials Science And Engineering PropertiesCivil EngineeringISBN:9781111988609Author:Charles GilmorePublisher:Cengage Learning
 Construction Materials, Methods and Techniques (M...Civil EngineeringISBN:9781305086272Author:William P. Spence, Eva KultermannPublisher:Cengage Learning
 Principles of Foundation Engineering (MindTap Cou...Civil EngineeringISBN:9781337705028Author:Braja M. Das, Nagaratnam SivakuganPublisher:Cengage Learning


