Concept explainers
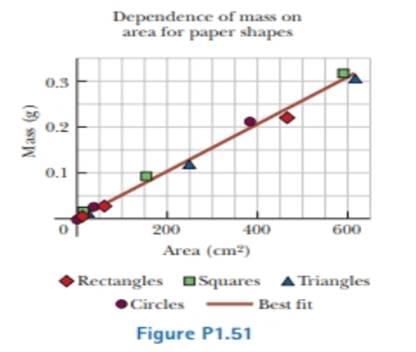
Review. A student is supplied with a stack of copy paper, ruler, compass, scissors, and a sensitive balance. He cuts out various shapes in various sizes, calculates their areas, measures their masses, and prepares the graph of Figure PI.51. (a) Consider the fourth experimental point from the top. How far is it from the best-lit straight line? Express your answer as a difference in vertical-axis coordinate, (b) Express your answer as a percentage, (c) Calculate the slope of the line, (d) State what the graph demonstrates, referring to the shape of the graph and the results of parts (b) and (c). (e) Describe whether this result should be expected theoretically, (f) Describe the physical meaning of the slope.

(a)
The distance of the fourth experimental point from the top from the best –fit straight line.
Answer to Problem 1.51P
The distance of the fourth experimental point from the top from the best fit straight line is
Explanation of Solution
Given data: The student is supplied with a stack of copy paper, ruler, compass, scissors, and a sensitive balance. A graph mass versus area is plotted for different sizes of the paper.
Consider the following figure.

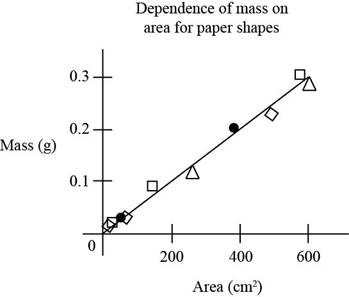
Figure (1)
Figure indicates the graph plotted area of pieces versus mass of the pieces of the paper.
The fourth experimental point from the top is a circle. It lies slightly above the best fit line.
From figure (1), the vertical coordinate for the forth experiment is
So the difference in the vertical axis coordinate is,
Here,
Substitute
Conclusion:
Therefore the distance of the fourth experimental point from the top from the best fit straight line is
(b)
The answer in the form of percentage.
Answer to Problem 1.51P
The answer in the form of percentage is
Explanation of Solution
Given data: The student is supplied with a stack of copy paper, ruler, compass, scissors, and a sensitive balance. A graph mass versus area is plotted for different sizes of the paper.
The expression for the percentage is,
Substitute
Conclusion:
Therefore the answer in the form of percentage is
(c)
The slope of the line.
Answer to Problem 1.51P
The slope of the line is
Explanation of Solution
Given data: The student is supplied with a stack of copy paper, ruler, compass, scissors, and a sensitive balance. A graph mass versus area is plotted for different sizes of the paper.
The expression for the slope is,
Here,
Substitute
Conclusion:
Therefore the slope of the line is
(d)
The demonstration from the graph referring to the shape of the graph and the results of part (b) and (c).
Answer to Problem 1.51P
The graph demonstrates that the mass of the cutout is proportional to its area for the shape cuts from this copy paper and the proportionality constant is
Explanation of Solution
Given data: The student is supplied with a stack of copy paper, ruler, compass, scissors, and a sensitive balance. A graph mass versus area is plotted for different sizes of the paper.
The graph given figure (1) demonstrates that the mass of the cutout in each shape is proportional to its area for the shape cuts from this copy paper and the proportionality constant is
The value of the slope from part (c) of the question and from the part (b) question the percentage uncertainty is
Conclusion:
Therefore the graph demonstrates that the mass of the cutout is proportional to its area for the shape cuts from this copy paper and the proportionality constant is
(e)
Whether this result should be expected theoretically or not.
Answer to Problem 1.51P
This result is to be expected theoretically if the paper has thickness and density that are uniform within the experimental uncertainty.
Explanation of Solution
Given data: The student is supplied with a stack of copy paper, ruler, compass, scissors, and a sensitive balance. A graph mass versus area is plotted for different sizes of the paper.
The graph given figure (1) demonstrates that the mass of the cutout in each shape is proportional to its area for the shape cuts from this copy paper and the proportionality constant is
The value of the slope from part (c) of the question is
Thus this result is expected theoretically when the object is having same aerial mass density and the paper has thickness and density that are uniform within the experimental uncertainty.
Conclusion:
Therefore this result is to be expected theoretically if the paper has thickness and density that are uniform within the experimental uncertainty.
(f)
The physical meaning of the slope.
Answer to Problem 1.51P
The physical meaning of the slope is the aerial density of the paper that represents the mass per unit area.
Explanation of Solution
Given data: The student is supplied with a stack of copy paper, ruler, compass, scissors, and a sensitive balance. A graph mass versus area is plotted for different sizes of the paper.
The graph given figure (1) demonstrates that the mass of the cutout in each shape is proportional to its area for the shape cuts from this copy paper and the proportionality constant is
The value of the slope from part (c) of the question is
The physical meaning of the slope is the aerial density of the paper that represent the mass per unit area.
Conclusion:
Therefore the physical meaning of the slope is the aerial density of the paper that represents the mass per unit area.
Want to see more full solutions like this?
Chapter 1 Solutions
EBK PHYSICS FOR SCIENTISTS AND ENGINEER
Additional Science Textbook Solutions
Biology: Concepts and Investigations
Applications and Investigations in Earth Science (9th Edition)
Biology: Life on Earth (11th Edition)
Organic Chemistry
Fundamentals Of Thermodynamics
Laboratory Manual For Human Anatomy & Physiology
- Students are asked to use circular motion to measure the coefficient of static friction between two materials. They have a round turntable with a surface made from one of the materials, for which they can vary the speed of rotation. They also have a small block of mass m made from the sec- ond material. A rough sketch of the apparatus is shown in the figure below. Additionally they have equipment normally found in a physics classroom. Axis m (a) Briefly describe a procedure that would allow you to use this apparatus to calculate the coefficient of static friction, u. (b) Based on your procedure, determine how to analyze the data collected to calculate the coefficient of friction. (c) One group of students collects the following data. r (m) fm (rev/s) 0.050 1.30 0.10 0.88 0.15 0.74 0.20 0.61 0.25 0.58 i. Use the empty spaces in the table as needed to calculate quantities that would allow you to use the slope of a line graph to calculate the coefficient of friction, providing labels with…arrow_forwardPART Aarrow_forwardanswer both questionarrow_forward
- Only part A.) of the questionarrow_forwardIn general it is best to conceptualize vectors as arrows in space, and then to make calculations with them using their components. (You must first specify a coordinate system in order to find the components of each arrow.) This problem gives you some practice with the components. Let vectors A = (1,0, -3), B = (-2, 5, 1), and C = (3,1,1). Calculate the following, and express your answers as ordered triplets of values separated by commas.arrow_forwardIn general it is best to conceptualize vectors as arrows in space, and then to make calculations with them using their components. (You must first specify a coordinate system in order to find the components of each arrow.) This problem gives you some practice with the components. Let vectors A = (1,0, −3), B = (-2, 5, 1), and C = (3,1,1). Calculate the following, and express your answers as ordered triplets of values separated by commas.arrow_forward
- In general it is best to conceptualize vectors as arrows in space, and then to make calculations with them using their components. (You must first specify a coordinate system in order to find the components of each arrow.) This problem gives you some practice with the components. Let vectors A = (1,0, -3), B = (-2, 5, 1), and C = (3,1,1). Calculate the following, and express your answers as ordered triplets of values separated by commas.arrow_forwardfine the magnitude of the vector product express in sq meters what direction is the vector product in -z or +zarrow_forward4) Three point charges of magnitude Q1 = +2.0 μC, Q2 = +3.0 μС, Q3 = = +4.0 μС are located at the corners of a triangle as shown in the figure below. Assume d = 20 cm. (a) Find the resultant force vector acting on Q3. (b) Find the magnitude and direction of the force. d Q3 60° d Q1 60° 60° Q2 darrow_forward
 College PhysicsPhysicsISBN:9781305952300Author:Raymond A. Serway, Chris VuillePublisher:Cengage Learning
 University Physics Volume 1PhysicsISBN:9781938168277Author:William Moebs, Samuel J. Ling, Jeff SannyPublisher:OpenStax - Rice University
 Principles of Physics: A Calculus-Based TextPhysicsISBN:9781133104261Author:Raymond A. Serway, John W. JewettPublisher:Cengage Learning
 Physics for Scientists and Engineers: Foundations...PhysicsISBN:9781133939146Author:Katz, Debora M.Publisher:Cengage Learning
 Classical Dynamics of Particles and SystemsPhysicsISBN:9780534408961Author:Stephen T. Thornton, Jerry B. MarionPublisher:Cengage Learning
 Physics for Scientists and EngineersPhysicsISBN:9781337553278Author:Raymond A. Serway, John W. JewettPublisher:Cengage Learning


