As part of a science project, you study traffic patterns in your city at an intersection in the middle of downtown. You set up a device that counts the cars passing through this intersection for a 24-hour period during a weekday. The graph of hourly traffic looks like this. a. At what time(s) does the highest number of cars pass through the intersection? b. At what time(s) does the lowest number of cars pass through the intersection? c. Briefly describe the trend in numbers of cars over the course of the day. d. Provide a hypothesis explaining the trend in numbers of cars over the course of the day. e. Provide a possible experiment that could test your hypothesis.
As part of a science project, you study traffic patterns in your city at an intersection in the middle of downtown. You set up a device that counts the cars passing through this intersection for a 24-hour period during a weekday. The graph of hourly traffic looks like this. a. At what time(s) does the highest number of cars pass through the intersection? b. At what time(s) does the lowest number of cars pass through the intersection? c. Briefly describe the trend in numbers of cars over the course of the day. d. Provide a hypothesis explaining the trend in numbers of cars over the course of the day. e. Provide a possible experiment that could test your hypothesis.
Solution Summary: The author explains the scientific method to explain the trends of traffic. The graph shows the highest and lowest number of cars passing through the intersection.
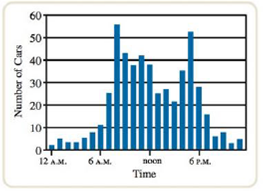
As part of a science project, you study traffic patterns in your city at an intersection in the middle of downtown. You set up a device that counts the cars passing through this intersection for a 24-hour period during a weekday. The graph of hourly traffic looks like this.
a. At what time(s) does the highest number of cars pass through the intersection?
b. At what time(s) does the lowest number of cars pass through the intersection?
c. Briefly describe the trend in numbers of cars over the course of the day.
d. Provide a hypothesis explaining the trend in numbers of cars over the course of the day.
e. Provide a possible experiment that could test your hypothesis.
When talking about the acidity of carboxylic acids, is it the same thing to say higher or stronger acidity?
Using the following two half-reactions, determine the pH range in which $NO_2^-\ (aq)$ cannot be found as the predominant chemical species in water.* $NO_3^-(aq)+10H^+(aq)+8e^-\rightarrow NH_4^+(aq)+3H_2O(l),\ pE^{\circ}=14.88$* $NO_2^-(aq)+8H^+(aq)+6e^-\rightarrow NH_4^+(aq)+2H_2O(l),\ pE^{\circ}=15.08$
Indicate characteristics of oxodec acid.
Chapter 1 Solutions
Bundle: Chemistry: An Atoms First Approach, Loose-leaf Version, 2nd + OWLv2 with Student Solutions Manual, 4 terms (24 months) Printed Access Card
Need a deep-dive on the concept behind this application? Look no further. Learn more about this topic, chemistry and related others by exploring similar questions and additional content below.
Author:Steven D. Gammon, Ebbing, Darrell Ebbing, Steven D., Darrell; Gammon, Darrell Ebbing; Steven D. Gammon, Darrell D.; Gammon, Ebbing; Steven D. Gammon; Darrell
Author:Steven D. Gammon, Ebbing, Darrell Ebbing, Steven D., Darrell; Gammon, Darrell Ebbing; Steven D. Gammon, Darrell D.; Gammon, Ebbing; Steven D. Gammon; Darrell
Atomic Number, Atomic Mass, and the Atomic Structure | How to Pass ChemistryThe Nucleus: Crash Course Chemistry #1; Author: Crash Course;https://www.youtube.com/watch?v=FSyAehMdpyI;License: Standard YouTube License, CC-BY


 General Chemistry - Standalone book (MindTap Cour...ChemistryISBN:9781305580343Author:Steven D. Gammon, Ebbing, Darrell Ebbing, Steven D., Darrell; Gammon, Darrell Ebbing; Steven D. Gammon, Darrell D.; Gammon, Ebbing; Steven D. Gammon; DarrellPublisher:Cengage Learning
 Introductory Chemistry: A FoundationChemistryISBN:9781337399425Author:Steven S. Zumdahl, Donald J. DeCostePublisher:Cengage Learning
 ChemistryChemistryISBN:9781305957404Author:Steven S. Zumdahl, Susan A. Zumdahl, Donald J. DeCostePublisher:Cengage Learning
 Chemistry: The Molecular ScienceChemistryISBN:9781285199047Author:John W. Moore, Conrad L. StanitskiPublisher:Cengage Learning
 Chemistry: Matter and ChangeChemistryISBN:9780078746376Author:Dinah Zike, Laurel Dingrando, Nicholas Hainen, Cheryl WistromPublisher:Glencoe/McGraw-Hill School Pub Co