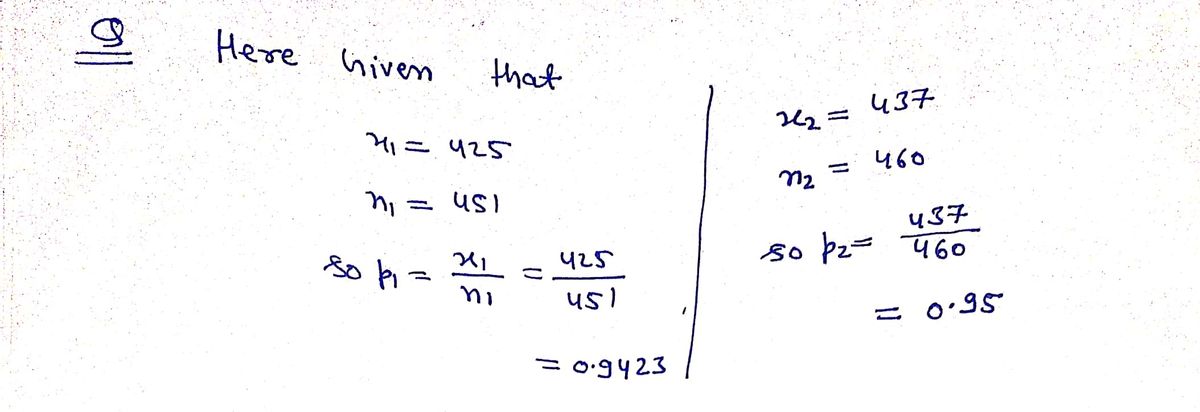
You wish to test the following claim (Ha) at a significance level of a = 0.02. P2 Ho: P₁ Ha: P₁ P2 = You obtain 425 successes in a sample of size n₁ = 451 from the first population. You obtain 437 successes in a sample of size n2 = 460 from the second population. For this test, you should NOT use the continuity correction, and you should use the normal distribution as an approximation for the binomial distribution. What is the test statistic for this sample? (Report answer accurate to three decimal places.) test statistic = What is the p-value for this sample? (Report answer accurate to four decimal places.) p-value =
Q: You wish to test the following claim (HaHa) at a significance level of α=0.10 Ho:p1=p2…
A: Given: H0:p1=p2H1:p1<p2 (claim) Sample 1 success x1=193 Sample 1 failure y1=492 Sample 2 success…
Q: ou wish to test the following at a significance level of α=0.05α=0.05. H0:p=0.19H0:p=0.19…
A: Givenn=596x=103p^=xn=103596=0.1728α=0.05H0:p=0.19H1:p<0.19
Q: You wish to test the following at a significance level of α=0.10α=0.10. H0:p=0.22H0:p=0.22…
A: From the given information, let X be the number of successful observations. X = 51. Total number of…
Q: You wish to test the following claim (Ha) at a significance level of a = 0.10. H.:p = 0.44 Ha:p <…
A: Given, The sample proportion is, The null and alternative hypothesis is:
Q: You wish to test the following claim (H) at a significance level of a = 0.005. Ho P1 P2 Ha P1 P2 You…
A: To testH0:p1=p2H1:p1=p2Now for sample 1number of successx1=42sample sizen1=42+380=422so…
Q: You wish to test the following claim (Ha) at a significance level of a = 0.02. Ho: P₁ = P2 Ha: P1 P2…
A:
Q: You wish to test the following claim (Ha) at a significance level of α=0.02 Ho:p1=p2…
A: State the appropriate hypothesis: Let p1 be the population proportion of successes in first…
Q: You wish to test the following claim (H) at a significance level of a = 0.002. Ho: P₁ = P2 Ha: P₁ P₂…
A: From the provided information,
Q: You wish to test the following claim (Ha) at a significance level of α=0.005. Ho:p1=p2…
A: Given: The provided data is: Sample size Success Sample 1 n1=580 X=490 Sample 2 n2=407…
Q: You wish to test the following claim (Ha) at a significance level of α=0.01 Ho:p1=p2…
A:
Q: You wish to test the following claim (Ha) at a significance level of a = 0.10. H.:P1 = P2 Ha:P1 < P2…
A: Given, Level of significance α=0.10 Hypotheses: H0:p1=p2H1:p1<p2 Number of successes from the…
Q: You wish to test the following claim (HaHa) at a significance level of α=0.02. Ho:p1=p2…
A: Test statistic for z-test:There are 75.1% successes in a sample of size n1= 618 from the first…
Q: You wish to test the following claim (H) at a significance level of a = 0.002. Ho: P1 = P2 H₁: P1 P2…
A: The objective of this question is to test the hypothesis that the proportion of successes in two…
Q: You wish to test the following at a significance level of α=0.05α=0.05. H0:p=0.67H0:p=0.67…
A: First calculate the sample proportion (p^) as follows p^=Number of successful observationsTotal…
Q: mazon.com - Onl You wish to test the following claim (H) at a significance level of a = Ho: P1 = P2…
A: α=0.002n1=321p^1=0.474x1=0.474*321=152.15n2=713p^2=0.532x2=0.532*713=379.316p¯=x1+x2n1+n2=152.15+379…
Q: You wish to test the following claim (Ha) at a significance level of a 0.02.
A: The sample proportion is, p^=xn=154243=0.6337 The sample proportion is 0.6337. The test statistic…
Q: You wish to test the following claim (Ha) at a significance level of α=0.01. Ho:p1=p2…
A: Denote p1, p2 as the true proportions of successes of first and second populations, respectively.…
Q: est statistic = What is the p-value for this sample? (Report answer accurate to four decimal…
A: Given that number of successes 313 out of 606 samples and 357 successes out of 564
Q: ou wish to test the following claim (HaHa) at a significance level of α=0.02 Ho:p1=p2…
A: The hypotheses is given as: H0: p1 = p2 H1: p1 > p2 Given:
Q: You wish to test the following claim (Ha) at a significance level of α=0.05. Ho:p1=p2…
A: Denote p1, p2 as the true population proportions of first and second populations, respectively. Null…
Q: You wish to test the following claim (Ha) at a significance level of a = 0.05. Ha:Pi < P2 zd = Id:°H…
A:
Q: You wish to test the following claim (HaHa) at a significance level of α=0.001 Ho:p1=p2…
A: As per bartleby guidelines only first three subparts are to be solved. Please upload other parts…
Q: You wish to test the following claim (HaHa) at a significance level of α=0.05 Ho:p1=p2…
A:
Q: You wish to test the following claim (HaHa) at a significance level of α=0.01 Ho:p1=p2…
A:
Q: You wish to test the following claim (Ha) at a significance level of α=0.01. Ho:p1=p2…
A:
Q: You wish to test the following claim (Ha) at a significance level of a = 0.001. Ho: P₁ = P2 Ha: P₁…
A: From the provided information, Level of significance (α) = 0.001
Q: You wish to test the following claim (Ha) at a significance level of α=0.10. Ho:p1=p2…
A: Given information , n1 = 780 , x1 = 272 Sample proportion = p^1 = x1n1 = 272780 = 0.348718 n2 =…
Q: You wish to test the following claim (Ha) at a significance level of a = 0.05. Ho: P1 = P2 Ha: P1 P2…
A: Given; n1 = 271 Number of success X1 = 103 n2 = 362 Number of success X2 = 155 α = 0.05 Formula…
Q: You wish to test the following claim (H) at a significance level of a = 0.10. H.:P1 = P2 H.:P1 > P2…
A:
Q: You wish to test the following claim (HaHa) at a significance level of α=0.10 Ho:p1=p2…
A:
Q: You wish to test the following claim (Ha) at a significance level of α=0.005. Ho:p1=p2…
A: Denote p1, p2 as the true population proportions of 1srt and 2nd populations, respectively.
Q: You wish to test the following claim (Ha) at a significance level of α=0.05. Ho:p1=p2…
A:
Q: You wish to test the following claim (Ha) at a significance level of a = 0.01. Ho:Pi P2 H4 P i< P2…
A: Given Data and calculation is shown below
Q: You wish to test the following claim (Ha) at a significance level of a = 0.05. Ho: P1 = P2 Ha: P1 P2…
A: The following information has been given: p^1=0.176 p^2=0.11n1=598 n2=536
Q: You wish to test the following at a significance level of α=0.01. H0:p=0.83 H1:p<0.83…
A: Followings are the Explanation of the question Use the One sample Proportion Z test
Q: You wish to test the following at a significance level of α=0.05α=0.05. H0:p=0.64H0:p=0.64…
A: The hypotheses to be tested are:The level of significance is The sample size is The number of…
Q: You wish to test the following (Ha) at a significance level of a=0.05 Ha:u=0.38 Ha:p>0.38 You…
A:
Q: ou wish to test the following claim (Ha) at a significance level of α=0.001 Ho:p1=p2…
A:
Q: You wish to test the following claim (Ha) at a significance level of α=0.01α Ho:p=0.25…
A:
Step by step
Solved in 2 steps with 2 images
- You wish to test the following at a significance level of α=0.10α=0.10. H0:p=0.29H0:p=0.29 H1:p<0.29H1:p<0.29You obtain a sample of size n=352n=352 in which there are 88 successful observations.For this test, we use the normal distribution as an approximation for the binomial distribution.For this sample... The test statistic (zz) for the data = The p-value for the sample =You wish to test the following claim (HaHa) at a significance level of α=0.001. Ho:p=0.81Ho:p=0.81 Ha:p≠0.81Ha:p≠0.81You obtain a sample of size n=454n=454 in which there are 360 successful observations. For this test, you should NOT use the continuity correction, and you should use the normal distribution as an approximation for the binomial distribution.What is the test statistic for this sample? (Report answer accurate to three decimal places.)test statistic = What is the p-value for this sample? (Report answer accurate to four decimal places.)p-value = The p-value is... less than (or equal to) α greater than α This test statistic leads to a decision to... reject the null accept the null fail to reject the null As such, the final conclusion is that... There is sufficient evidence to warrant rejection of the claim that the population proportion is not equal to 0.81. There is not sufficient evidence to warrant rejection of the claim that the population proportion…You wish to test the following claim (Ha) at a significance level of α=0.01 Ho:p1 = p2 Ha:p1 > p2You obtain 69 successes in a sample of size n1=623 from the first population. You obtain 39 successes in a sample of size n2=430 from the second population. For this test, you should NOT use the continuity correction, and you should use the normal distribution as an approximation for the binomial distribution.What is the test statistic for this sample? (Report answer accurate to three decimal places.)test statistic = What is the p-value for this sample? (Report answer accurate to four decimal places.)p-value = The p-value is... less than (or equal to) α greater than α This test statistic leads to a decision to... reject the null accept the null fail to reject the null As such, the final conclusion is that... There is sufficient evidence to warrant rejection of the claim that the first population proportion is greater than the second population proportion. There is not…
- You wish to test the following claim (Ha) at a significance level of α=0.005 Ho:p=0.61Ho:p=0.61 Ha:p<0.61Ha:p<0.61You obtain a sample of size n=391n=391 in which there are 225 successful observations. For this test, you should NOT use the continuity correction, and you should use the normal distribution as an approximation for the binomial distribution.What is the test statistic for this sample? (Report answer accurate to three decimal places.)test statistic = _____________What is the p-value for this sample? (Report answer accurate to four decimal places.)p-value = _________ The p-value is... A.) less than (or equal to) αα B.) greater than αα This test statistic leads to a decision to... A.) reject the null B.) accept the null C.) fail to reject the null As such, the final conclusion is that... A.) There is sufficient evidence to warrant rejection of the claim that the population proportion is less than 0.61. B.) There is not sufficient evidence to warrant…You wish to test the following claim ( Ha) at a significance level of α =0.10. Ho: p= 0.62Ha: p> 0.62 You obtain a sample of size n=741 in which there are 466 successful observations. For this test, you should NOT use the continuity correction, and you should use the normal distribution as an approximation for the binomial distribution. What is the test statistic for this sample? (Report answer accurate to three decimal places.)test statistic = What is the p-value for this sample? (Report answer accurate to four decimal places.)p-value = The p-value is...less than (or equal to) αorgreater than α This test statistic leads to a decision to...reject the nullaccept the nullfail to reject the null As such, the final conclusion is that...There is sufficient evidence to warrant rejection of the claim that the population proportion is greater than 0.62.There is not sufficient evidence to warrant rejection of the claim that the population proportion is greater than 0.62.The sample data…You wish to test the following claim (Ha) at a significance level of α=0.10 Ho:p1=p2 Ha:p1>p2You obtain 97 successes in a sample of size n1=528 from the first population. You obtain 51 successes in a sample of size n2=576 from the second population. For this test, you should NOT use the continuity correction, and you should use the normal distribution as an approximation for the binomial distribution.What is the critical value for this test? (Report answer accurate to two decimal places.)critical value = What is the test statistic for this sample? (Report answer accurate to three decimal places.)test statistic = The test statistic is... in the critical region not in the critical region This test statistic leads to a decision to... reject the null accept the null fail to reject the null As such, the final conclusion is that... There is sufficient evidence to warrant rejection of the claim that the first population proportion is greater than the second…
- You wish to test the following claim (HaHa) at a significance level of α=0.001. Ho:p1=p2 Ha:p1<p2You obtain a sample from the first population with 407 successes and 58 failures. You obtain a sample from the second population with 366 successes and 42 failures. For this test, you should NOT use the continuity correction, and you should use the normal distribution as an approximation for the binomial distribution.What is the test statistic for this sample? (Report answer accurate to three decimal places.)test statistic = What is the p-value for this sample? (Report answer accurate to four decimal places.)p-value = The p-value is... less than (or equal to) αα greater than αα This test statistic leads to a decision to... reject the null accept the null fail to reject the null As such, the final conclusion is that... There is sufficient evidence to warrant rejection of the claim that the first population proportion is less than the second population proportion. There…You wish to test the following claim (HaHa) at a significance level of α=0.05α=0.05. Ho:p=0.45 Ha:p>0.45You obtain a sample of size n=584 in which there are 290 successful observations. For this test, you should NOT use the continuity correction, and you should use the normal distribution as an approximation for the binomial distribution.What is the critical value for this test? (Report answer accurate to two decimal places.)critical value = What is the standardized test statistic for this sample? (Report answer accurate to three decimal places.)standardized test statistic = The standardized test statistic is... in the critical region not in the critical region This standardized test statistic leads to a decision to... reject the null accept the null fail to reject the null As such, the final conclusion is that... There is sufficient evidence to warrant rejection of the claim that the population proportion is greater than 0.45. There is not sufficient evidence to…You wish to test the following claim (HaHa) at a significance level of α=0.01. Ho:p1=p2 Ha:p1<p You obtain 148 successes in a sample of size n1=577 from the first population. You obtain 230 successes in a sample of n2=658 from the second population. For this test, you should NOT use the continuity correction, and you should use the normal distribution as an approximation for the binomial distribution. What is the z-score of the critical value? (Report answer accurate to three decimal places.) What is the standardized test statistic for this sample? (Report answer accurate to three decimal places.) The test statistic is... in the critical region not in the critical region This test statistic leads to a decision to... reject the null accept the null fail to reject the null
- You wish to test the following at a significance level of α=0.05α=0.05. H0:p=0.41H0:p=0.41 H1:p>0.41H1:p>0.41You obtain a sample of size n=567n=567 in which there are 257 successful observations.For this test, we use the normal distribution as an approximation for the binomial distribution.For this sample... The test statistic (zz) for the data = (Please show your answer to three decimal places.) The p-value for the sample = (Please show your answer to four decimal places.) The p-value is... greater than αα less than (or equal to) αα (Recall that when p(-value) is low, the null must go; when p(-value) is high, the null must fly)Base on this, we should .... accept the null hypothesis reject the null hypothesis fail to reject the null hypothesis As such, the final conclusion is that... The sample data suggest that the population proportion is significantly greater than 0.41 at the significant level of αα = 0.05. The sample data suggest that the population…You wish to test the following claim (H) at a significance level of a = 0.05. Ho: P₁ = P2 Ha: P1 > P2 You obtain 58% successes in a sample of size n₁ = 790 from the first population. You obtain 48.6% successes in a sample of size n₂ = 276 from the second population. For this test, you should NOT use the continuity correction, and you should use the normal distribution as an approximation for the binomial distribution. What is the test statistic for this sample? (Report answer accurate to three decimal places.) test statistic = 1.552 x What is the p-value for this sample? (Report answer accurate to four decimal places.) p-value = 0.0603 x The p-value is... 03 less than (or equal to) a O greater than a This test statistic leads to a decision to... Oreject the null hypothesis O accept the null hypothesis O fail to reject the null hypothesis As such, the final conclusion is that... O There is sufficient evidence to warrant rejection of the claim that the first population proportion is…You wish to test the following claim (Ha) at a significance level of α=0.005α=0.005. Ho:p=0.61 Ha:p<0.61 You obtain a sample of size n=391n=391 in which there are 225 successful observations. For this test, you should NOT use the continuity correction, and you should use the normal distribution as an approximation for the binomial distribution.What is the test statistic for this sample? (Report answer accurate to three decimal places.)test statistic = ______What is the p-value for this sample? (Report answer accurate to four decimal places.)p-value = ______The p-value is... A.) less than (or equal to) αα B.) greater than α This test statistic leads to a decision to... A.)reject the null B.) accept the null C.) fail to reject the null As such, the final conclusion is that... A.)There is sufficient evidence to warrant rejection of the claim that the population proportion is less than 0.61. B.)There is not sufficient evidence to warrant rejection of the claim that…