You wish to test the following claim (Ha) at a significance level of a = 0.10. H.:p = 0.44 Ha:p < 0.44 488 in which there are 183 successful observations. For this test, You obtain a sample of size n = you should NOT use the continuity correction, and you should use the normal distribution as an approximation for the binomial distribution. What is the test statistic for this sample? (Report answer accurate to three decimal places.) test statistic =-2.892 x What is the p-value for this sample? (Report answer accurate to four decimal places.) p-value =| 0.0019
You wish to test the following claim (Ha) at a significance level of a = 0.10. H.:p = 0.44 Ha:p < 0.44 488 in which there are 183 successful observations. For this test, You obtain a sample of size n = you should NOT use the continuity correction, and you should use the normal distribution as an approximation for the binomial distribution. What is the test statistic for this sample? (Report answer accurate to three decimal places.) test statistic =-2.892 x What is the p-value for this sample? (Report answer accurate to four decimal places.) p-value =| 0.0019

MATLAB: An Introduction with Applications
6th Edition
ISBN:9781119256830
Author:Amos Gilat
Publisher:Amos Gilat
Chapter1: Starting With Matlab
Section: Chapter Questions
Problem 1P

Related questions

Topic Video
Question
100%
Keep getting the test sample wrong.

Transcribed Image Text:You wish to test the following claim (Ha) at a significance level of a = 0.10.
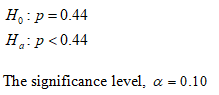
H.:p = 0.44
Ha:p < 0.44
You obtain a sample of sizen = 488 in which there are 183 successful observations. For this test,
you should NOT use the continuity correction, and you should use the normal distribution as an
approximation for the binomial distribution.
What is the test statistic for this sample? (Report answer accurate to three decimal places.)
test statistic = -2.892 x
What is the p-value for this sample? (Report answer accurate to four decimal places.)
p-value = 0.0019
Expert Solution
Step 1
Given,

The sample proportion is,
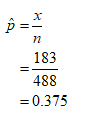
The null and alternative hypothesis is:
Step 2
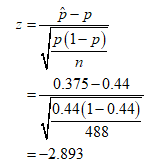
Calculate test statistic:
Under the null hypothesis, the test statistic for one sample proportion is,
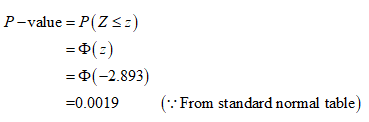
Compute P-value:

Step by step
Solved in 3 steps with 6 images

Knowledge Booster


Learn more about
Need a deep-dive on the concept behind this application? Look no further. Learn more about this topic, statistics and related others by exploring similar questions and additional content below.Recommended textbooks for you
MATLAB: An Introduction with Applications
Statistics
ISBN:
9781119256830
Author:
Amos Gilat
Publisher:
John Wiley & Sons Inc

Probability and Statistics for Engineering and th…
Statistics
ISBN:
9781305251809
Author:
Jay L. Devore
Publisher:
Cengage Learning

Statistics for The Behavioral Sciences (MindTap C…
Statistics
ISBN:
9781305504912
Author:
Frederick J Gravetter, Larry B. Wallnau
Publisher:
Cengage Learning
MATLAB: An Introduction with Applications
Statistics
ISBN:
9781119256830
Author:
Amos Gilat
Publisher:
John Wiley & Sons Inc
Probability and Statistics for Engineering and th…
Statistics
ISBN:
9781305251809
Author:
Jay L. Devore
Publisher:
Cengage Learning
Statistics for The Behavioral Sciences (MindTap C…
Statistics
ISBN:
9781305504912
Author:
Frederick J Gravetter, Larry B. Wallnau
Publisher:
Cengage Learning

Elementary Statistics: Picturing the World (7th E…
Statistics
ISBN:
9780134683416
Author:
Ron Larson, Betsy Farber
Publisher:
PEARSON

The Basic Practice of Statistics
Statistics
ISBN:
9781319042578
Author:
David S. Moore, William I. Notz, Michael A. Fligner
Publisher:
W. H. Freeman

Introduction to the Practice of Statistics
Statistics
ISBN:
9781319013387
Author:
David S. Moore, George P. McCabe, Bruce A. Craig
Publisher:
W. H. Freeman