You may need to use the appropriate technology to answer this question. Consider the data. 4.63 X; 2.153 Y₁ (a) Compute the mean square error using equation s² = MSE = 1 2 3 4 5 0.681 3 7 5 12 14 (b) Compute the standard error of the estimate using equation s = √/MSE = SSE n-2 (d) Use the t test to test the following hypotheses (a = 0.05): Ho: B₁ = 0 Ha: B₁ = 0 (Round your answer to two decimal places.) (c) Compute the estimated standard deviation of b, using equation Sb. - √ Σ(x;" SSE Find the p-value. (Round your answer to four decimal places.) p-value = 0.0286 n Find the value of the test statistic. (Round your answer to three decimal places.) 3.967 2 (Round your answer to three decimal places.) (Round your answer to three decimal places.) State your conclusion. O Reject Ho. We cannot conclude that the relationship between x and y is significant. O Do not reject Ho. We cannot conclude that the relationship between x and y is significant. O Do not reject Ho. We conclude that the relationship between x and y is significant.
You may need to use the appropriate technology to answer this question. Consider the data. 4.63 X; 2.153 Y₁ (a) Compute the mean square error using equation s² = MSE = 1 2 3 4 5 0.681 3 7 5 12 14 (b) Compute the standard error of the estimate using equation s = √/MSE = SSE n-2 (d) Use the t test to test the following hypotheses (a = 0.05): Ho: B₁ = 0 Ha: B₁ = 0 (Round your answer to two decimal places.) (c) Compute the estimated standard deviation of b, using equation Sb. - √ Σ(x;" SSE Find the p-value. (Round your answer to four decimal places.) p-value = 0.0286 n Find the value of the test statistic. (Round your answer to three decimal places.) 3.967 2 (Round your answer to three decimal places.) (Round your answer to three decimal places.) State your conclusion. O Reject Ho. We cannot conclude that the relationship between x and y is significant. O Do not reject Ho. We cannot conclude that the relationship between x and y is significant. O Do not reject Ho. We conclude that the relationship between x and y is significant.

MATLAB: An Introduction with Applications
6th Edition
ISBN:9781119256830
Author:Amos Gilat
Publisher:Amos Gilat
Chapter1: Starting With Matlab
Section: Chapter Questions
Problem 1P

Related questions
Question

Transcribed Image Text:You may need to use the appropriate technology to answer this question.
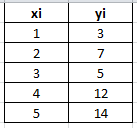
Consider the data.
4.63
X¡
2.153
Y₁
1 2
0.681
3
4
(a) Compute the mean square error using equation s² = MSE =
5
3 7 5 12 14
(b) Compute the standard error of the estimate using equation s = √/MSE =
SSE
n-2
5b1
(c) Compute the estimated standard deviation of b₁ using equation
(d) Use the t test test the following hypotheses (a = 0.05):
Ho: B₁ = 0
H₂B₁ 0
(Round your answer to two decimal places.)
Find the p-value. (Round your answer to four decimal places.)
p-value = 0.0286
=
SSE
n-2
VELXI
Find the value of the test statistic. (Round your answer to three decimal places.)
3.967
(Round your answer to three decimal places.)
(Round your answer to three decimal places.)
State your conclusion.
O Reject Ho. We cannot conclude that the relationship between x and y is significant.
Do not reject H. We cannot conclude that the relationship between x and y is significant.
O Do not reject Ho. We conclude that the relationship between x and y is significant.

Transcribed Image Text:● Reject Ho. We conclude that the relationship between x and y is significant.
(e) Use the F test to test the hypotheses in part (d) at a 0.05 level of significance. Present the results in the analysis of variance table format.
Set up the ANOVA table. (Round your values for MSE and F to two decimal places, and your p-value to three decimal places.)
Source
of Variation
Regression
Error
Total
Sum
of Squares
72.9
13.9
86.8
1
Degrees
of Freedom
3
4
Mean
Square
72.9
4.63
15.73
Find the value of the test statistic. (Round your answer to two decimal places.)
15.73
Find the p-value. (Round your answer to three decimal places.)
p-value = 0.029
F
State your conclusion.
O Do not reject Ho. We cannot conclude that the relationship between x and y is significant.
● Reject Ho. We conclude that the relationship between x and y is significant.
O Reject H₂. We cannot conclude that the relationship between x and y is significant.
O Do not reject Ho. We conclude that the relationship between x and y is significant.
p-value
0.029
Expert Solution
Step 1: Determine the given variables.
The question is about regression.
Given :
No. of pairs of xi and yi ( n ) = 5
To find :
a ) Mean square error
b ) standard error of the estimate
c ) standard deviation of b1
d ) Test the slope using t test.
e ) Test the slope using F test.

Step by step
Solved in 8 steps with 27 images

Recommended textbooks for you
MATLAB: An Introduction with Applications
Statistics
ISBN:
9781119256830
Author:
Amos Gilat
Publisher:
John Wiley & Sons Inc

Probability and Statistics for Engineering and th…
Statistics
ISBN:
9781305251809
Author:
Jay L. Devore
Publisher:
Cengage Learning

Statistics for The Behavioral Sciences (MindTap C…
Statistics
ISBN:
9781305504912
Author:
Frederick J Gravetter, Larry B. Wallnau
Publisher:
Cengage Learning
MATLAB: An Introduction with Applications
Statistics
ISBN:
9781119256830
Author:
Amos Gilat
Publisher:
John Wiley & Sons Inc
Probability and Statistics for Engineering and th…
Statistics
ISBN:
9781305251809
Author:
Jay L. Devore
Publisher:
Cengage Learning
Statistics for The Behavioral Sciences (MindTap C…
Statistics
ISBN:
9781305504912
Author:
Frederick J Gravetter, Larry B. Wallnau
Publisher:
Cengage Learning

Elementary Statistics: Picturing the World (7th E…
Statistics
ISBN:
9780134683416
Author:
Ron Larson, Betsy Farber
Publisher:
PEARSON

The Basic Practice of Statistics
Statistics
ISBN:
9781319042578
Author:
David S. Moore, William I. Notz, Michael A. Fligner
Publisher:
W. H. Freeman

Introduction to the Practice of Statistics
Statistics
ISBN:
9781319013387
Author:
David S. Moore, George P. McCabe, Bruce A. Craig
Publisher:
W. H. Freeman