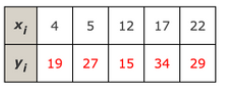
The standard error for the estimate is used in tests for a significant relationship between two variables. It is calculated as follows, where MSE is the mean square error. Note that MSE is calculated using the sum of squares due to error and the number of observations. S = √MSE X; SSE 2 Yi n Therefore, before the standard error can be found we must find the estimated regression equation for the given data, then calculate the predicted values of ŷ, to find the SSE. The data are given below. where SSE = - Σ(Y₁-9;)² 4 5 12 17 22 19 27 15 34 29 There are 5 observations in the data, so we have n = 5 Find the estimated regression equation for these data using the least squares method.
The standard error for the estimate is used in tests for a significant relationship between two variables. It is calculated as follows, where MSE is the mean square error. Note that MSE is calculated using the sum of squares due to error and the number of observations. S = √MSE X; SSE 2 Yi n Therefore, before the standard error can be found we must find the estimated regression equation for the given data, then calculate the predicted values of ŷ, to find the SSE. The data are given below. where SSE = - Σ(Y₁-9;)² 4 5 12 17 22 19 27 15 34 29 There are 5 observations in the data, so we have n = 5 Find the estimated regression equation for these data using the least squares method.

MATLAB: An Introduction with Applications
6th Edition
ISBN:9781119256830
Author:Amos Gilat
Publisher:Amos Gilat
Chapter1: Starting With Matlab
Section: Chapter Questions
Problem 1P

Related questions
Question

Transcribed Image Text:The standard error for the estimate is used in tests for a significant relationship between two variables. It is calculated as follows, where MSE is the mean square error. Note that MSE is
calculated using the sum of squares due to error and the number of observations.
S =
=
VMSE
X;
Yi
SSE
2
n-
4
where
Therefore, before the standard error can be found we must find the estimated regression equation for the given data, then calculate the predicted values of y; to find the SSE. The data
are given below.
SSE =
=Σ( V₁ - 1₁) ²
5 12 17 22
19 27 15 34 29
There are 5 observations in the data, so we have n = 5
Find the estimated regression equation for these data using the least squares method.
ŷ =
Expert Solution
Step 1
Given :

Step by step
Solved in 4 steps with 4 images

Recommended textbooks for you
MATLAB: An Introduction with Applications
Statistics
ISBN:
9781119256830
Author:
Amos Gilat
Publisher:
John Wiley & Sons Inc

Probability and Statistics for Engineering and th…
Statistics
ISBN:
9781305251809
Author:
Jay L. Devore
Publisher:
Cengage Learning

Statistics for The Behavioral Sciences (MindTap C…
Statistics
ISBN:
9781305504912
Author:
Frederick J Gravetter, Larry B. Wallnau
Publisher:
Cengage Learning
MATLAB: An Introduction with Applications
Statistics
ISBN:
9781119256830
Author:
Amos Gilat
Publisher:
John Wiley & Sons Inc
Probability and Statistics for Engineering and th…
Statistics
ISBN:
9781305251809
Author:
Jay L. Devore
Publisher:
Cengage Learning
Statistics for The Behavioral Sciences (MindTap C…
Statistics
ISBN:
9781305504912
Author:
Frederick J Gravetter, Larry B. Wallnau
Publisher:
Cengage Learning

Elementary Statistics: Picturing the World (7th E…
Statistics
ISBN:
9780134683416
Author:
Ron Larson, Betsy Farber
Publisher:
PEARSON

The Basic Practice of Statistics
Statistics
ISBN:
9781319042578
Author:
David S. Moore, William I. Notz, Michael A. Fligner
Publisher:
W. H. Freeman

Introduction to the Practice of Statistics
Statistics
ISBN:
9781319013387
Author:
David S. Moore, George P. McCabe, Bruce A. Craig
Publisher:
W. H. Freeman