You are interested in finding a 98% confidence interval for the average commute that non-residential students have to their college. The data below show the number of commute miles for 10 randomly selected non-residential college students. Round answers to 3 decimal places where possible. 27 20 12 8 5 25 5 21 28 27 b. With 98% confidence the population mean commute for non-residential college students is between ? and ? miles. c. If many groups of 10 randomly selected non-residential college students are surveyed, then a different confidence interval would be produced from each group. About ? percent of these confidence intervals will contain the true population mean number of commute miles and about ? percent will not contain the true population mean number of commute miles.


You are interested in finding a 98% confidence interval for the average commute that non-residential students have to their college. The data below show the number of commute miles for 10 randomly selected non-residential college students. Round answers to 3 decimal places where possible.
27
20
12
8
5
25
5
21
28
27
b. With 98% confidence the population
c. If many groups of 10 randomly selected non-residential college students are surveyed, then a different confidence interval would be produced from each group. About ? percent of these confidence intervals will contain the true population mean number of commute miles and about ? percent will not contain the true population mean number of commute miles.
b.
Using EXCEL function, “=AVERAGE(A1:A10)”, and “=STDEV.S(A1:A10)”, the values of sample mean and sample standard deviation is as given below:
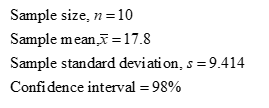
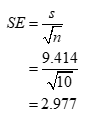
Here, the population standard deviation is not known. So, it is appropriate to use t-interval.

Step by step
Solved in 2 steps with 4 images


