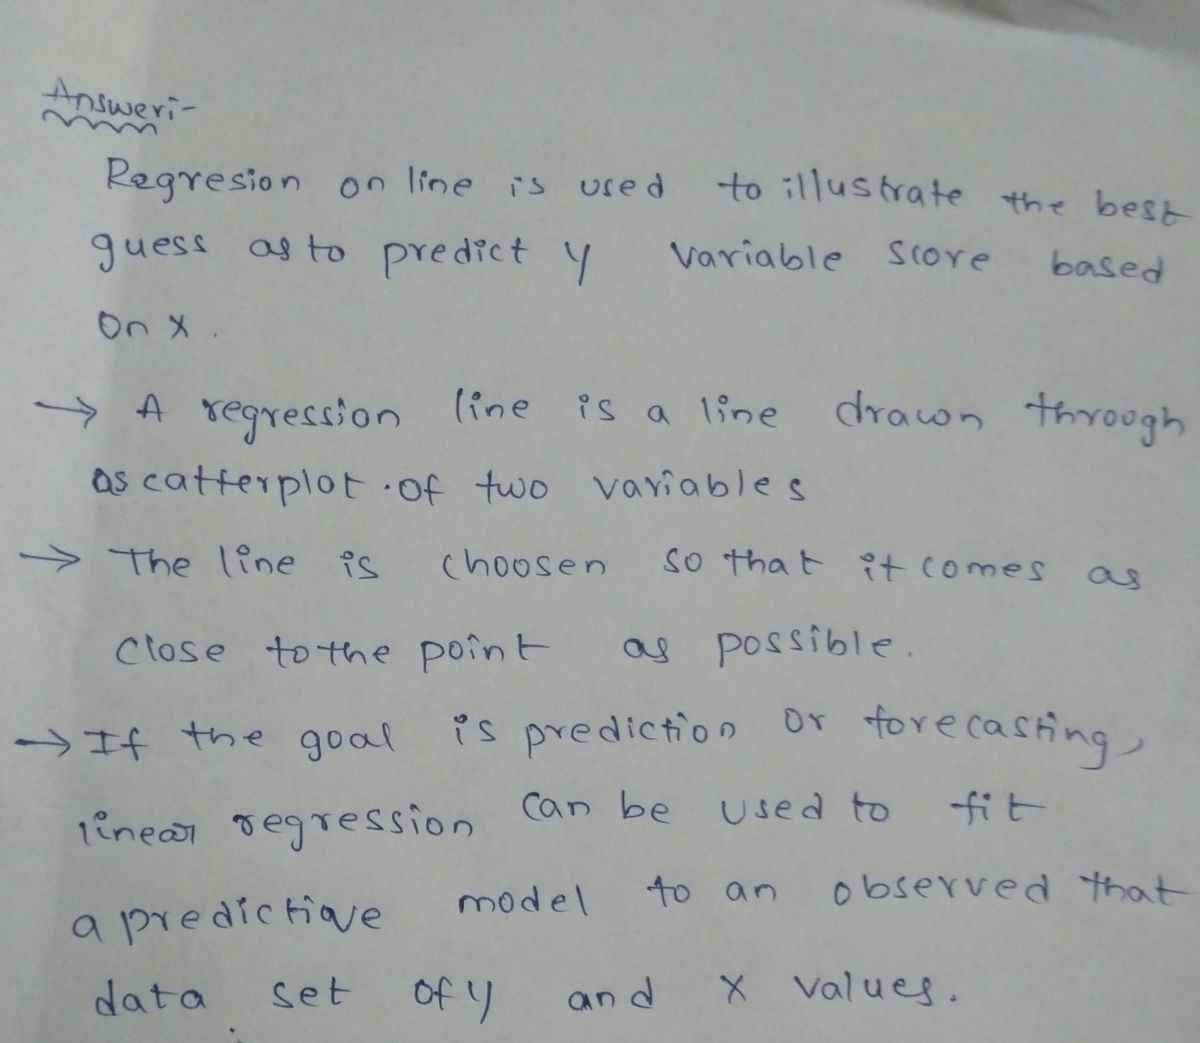
Which of the following is used to illustrate the “best guess” as to the predicted Y variable score based on X? Group of answer choices regression line standard error of the estimate scatter plot F equation
Q: Fill in the blanks to complete the paragraph. The methods of linear regression ▼ should not be…
A: The regression model shows a relationship between 1 dependent variable and 1 or more independent…
Q: statistics related to the Employed column of the longley data.frame. We can access this data…
A: Hi! Thank you for the question, As per the honor code, we are allowed to answer three sub-parts at a…
Q: Find the regression equation, letting overhead width be the predictor (x) variable. Find the best…
A: It was stated overhead width be the be the predictor (x) variable. The given data is as follows:…
Q: Select all correct interpretation of the estimated slope coefficient for income. There are three…
A: If Wisconsin's per -capita income decreased by 10% while its life expectancy, high school graduation…
Q: (d) Find and interpret the slope of the regression line. (e) Find and interpret the intercept of the…
A: d) In the given situation, the independent variable is 'price' and the dependent variable is…
Q: The accompanying data are the number of wins and the earned run averages (mean number of earned runs…
A: Steps to construct scatter plot in Excel: Enter the data for x and y in Excel sheet>Select the…
Q: The accompanying data are the number of wins and the earned run averages (mean number of earned…
A: Note: Hey there! Thank you for the question. As you have posted a question with multiple sub-parts,…
Q: (b) Predict the ERA for 10 wins, if it is meaningful. Select the correct choice below and, if…
A: Introduction: We have obtained the regression equation using Excel. First, we have entered the data…
Q: longley is a built-in R data.frame which is sometimes used in economics to study regression. We are…
A: Solution -Given that , The values of x are as follows x: 60.323, 61.122, 60.171, 61.187, 63.221,…
Q: PROBLEM 2 A social media researcher tests a theory predicting that the number of…
A:
Q: The regression output below shows the relation between exam score and gender (coded as "0" for male…
A:
Q: Type the regression equation for “Area” and “Biomass” in context into your document. Interpret…
A: Here we have, The dependent variable: Biomass (y) The independent variable: Area (x)
Q: Do regression analysis for the following data set. X Y 7 -57.8 5 -30.7 3 2.7 2 31.9 1 65.1 a) Find…
A: Given: n = 5 Formula Used: Equation of the straight line Y = mX + c Where, m is the slope c is the…
Q: Looking at the regression results above, which of the two variables, the square footage or the…
A: Here Given Summary output for the relationship between Home selling price with the square footage…
Q: QUESTION 29 In the following estimated regression equation = b0 + b1x, O a. b1 is the slope. O b. b1…
A: It is given that the estimated regression equation =b0+b1x.
Q: Please view the following attached image and answer the multiple choice question
A: We have given the data set is: We have calculated the intercept using the excel as:
Q: The data show the bug chirps per minute at different temperatures. Find the regression equation,…
A:
Q: Estimate of error standard deviation: 0.5210033 Parameter estimates (rounded): Parameter Estimate…
A: The regression model is the method of estimating the value of the variable by the value of the other…
Q: please show work and fill in the blank
A:
Q: In static forecasting (regression analysis), how is the p-value or significance of F-value used: A…
A: The f-value is the test statistic of the regression analysis while p-value is the probability of…
Q: A pesticide was sprayed at different concentrations to control a pest. Regression analysis of…
A: A pesticide was sprayed at different concentrations to control pest. Regression analysis of…
Q: uses af Determine the estimated regression equation 4 =B₁ + B₁ X the least squares method. b. Based…
A: Here dependent variable (Y) = Heart disease Independent variable (X) = Body Mass Index Sample size…
Q: B/Fit a straight line to the data given below. Also estimate the value of y at x-2.5. 3 4. 1.8 3.3…
A: Normal equations are as below : Given values :
Q: Determine whether the data set shows a direct variation. If so, write an equation that describes the…
A: The data set. We have to check whether the given data set shows a direct variation or not, If yes…
Q: Cholesterol Does a person’s cholesterol level tend tochange with age? Data collected from 1406…
A: a. The given information is that the regression analysis shows for the 1,406 adults aged 45 to 62 as…
Q: What slope I? If you create a regression model for predicting the Weight of a car (in pounds) from…
A:
Q: don Completion Status: Number of people on the subway = 37 22 21 32 3 36 25 39 19 10 31 147 22 Day…
A:
Q: A researcher interested in explaining the level of foreign reserves for the country of Barbados…
A: Given information: The multiple regression model is: FR=α+βOIL+γEXP+δFDI The MINITAB results are…
Q: The owner of Showtime Movie Theaters, Inc., used multiple regression analysis to predict gross…
A: Multiple Linear Regression: It is a model that is used for predicting the one dependent variable (y)…
Q: A diligent statistics student recorded the length of hisfaithful #2 pencil as he worked away on his…
A:
Q: Functions Supplement [Type here] Section 3.4 For each of the following data sets: plot the data,…
A: Note: Hey, since there are multiple questions are posted, we will answer first questions for you. If…
Q: The accompanying data are the number of wins and the earned run averages (mean number of earned runs…
A: The data shows the number of wins and the earned run averages for eight baseball pitchers in a…
Q: Which of the following is the point at which the regression line crosses the y-axis? Group of answer…
A:
Q: The table below shows the regression output with sales as the dependent variable and advertising…
A: Given that,Sales is the dependent variable and advertising expenditure ($) and time period t (year)…
Q: Which one of the following statements identify a condition where most analysts performing regression…
A: Here we have to identify the correct statement about slope of regression equation and correlation…
Q: 12:51 K A pediatrician wants to determine the relation that exists between a child's height, x, and…
A:
Q: Two common measures of the regression model’s fit to the data are … Group of answer choices…
A: The objective of the question is to identify the two common measures that are used to assess the fit…
Q: The following multiple regression printout can be used to predict a person's height (in inches)…
A: The coefficient of the shoe size is 1.167 and the SE of Coefficient is 0.19.
Q: K Find the slope and y-intercept of the line whose graph is own Slope= (Simplify your answer. Type…
A:
Q: The accompanying data are the number of wins and the earned run averages (mean number of earned runs…
A: The scatterplot is obtained by using EXCEL. The software procedure is given below: In first column…
Q: Please no written by hand solutions 3. A researcher is interested in the correlation between a…
A: The regression line can be written as: Minutes of sleep = 150 - 5(age) To find the predicted…
Q: The accompanying data are the number of wins and the eaned ru Then construct a scatter plot of the…
A: We want to find equation of regression line and predict at A) X=5 B) X=10 C) X=19 Note: According…
Q: The retail price of 8 laptops along with their corresponding processor speeds in gigahertz are given…
A: “Since you have posted a question with multiple sub-parts, we will solve first three subparts for…
Q: What is the interpretation of the intercept regression coefficient in a regression model? A. The…
A: The question is asking about the interpretation of the intercept in a regression model. In a simple…
Q: A sales manager for an advertising agency believes there is a relationship between the number of…
A: Solution : Given , A regression analysis shows the following results. Coefficients Standard Error…
Q: Listed below are systolic blood pressure measurements (in mm Hg) obtained from the same woman. Find…
A: Introduction: Consider that x is the independent variable and y is the dependent variable. The size…
Q: The accompanying data are the number of wins and the earned run averages (mean number of earned runs…
A: The data shows the number of wins and the earned run averages for eight baseball pitchers in a…
Q: Find the regression equation, letting the first vVarnable be the predictor (x) variable Using the…
A: Software procedure for regression in EXCEL. Enter the given data in EXCEL sheet as Lemon imports in…
Q: The accompanying data are the number of wins and the earmed run averages (mean number of earned runs…
A: The independent variable is Wins. The dependent variable is Earned run average. This is simple…
Trending now
This is a popular solution!
Step by step
Solved in 2 steps with 2 images
- Why this type of plot is used in analysing regression modelsJ 1 The accompanying table shows results from regressions performed on data from a random sample of 21 cars. The response why variable is city fuel consumption in miles/gallons. The predictor X variables are weight weight in pounds, DISP engine displacement leaders NHW Y Highway fuel consumption in miles/gallons. It's only one predictor X variable is used to predict the city fuel consumption, which single variable is best? Why? The best variable is (WT/HWY/DISP) because it has the best combination of (large/small) p-value, (answer) and (large/small) adjusted R^2 (answer) (type integers are decimals. Do not round)tot Consider the scatterplot given above. Which of the following could be the value of r? O A. 0.913 О В. -0.124 O C. -0.906 O D. 0.725 Given that the regression line has a slope of 0.345 and a y-intercept of - 0.296, find the slope-intercept equation of the regression line. y =| Use the regression line to predict the y-value for the x-value of - 0.627. (Round to three decimal places). y =
- QUESTIONS ---- D AND FWhich of the following denotes the slope or the regression coefficient for X? A) The term a B) The term b C) The error term D) The correlation coefficient, rQuestion. Using the following regression result, make your answers to the questions. Call: Im(formula - wage - educ, data - data) Residuals: 10 Median -5.1579 -2.5066 0.3816 2.4539 4.4737 Min 30 Max Coefficients: Estimate Std. Error t value Pr(>1tl) (Intercept) 9.0526 educ 5.1420 1.761 0.11635 2.1842 0.5994 3.644 0.00655 ** --- Signif. codes: 0 ***** 0.001 *** 0.01 ** 0.05 . 0.1' 1 Residual standard error: 3.305 on 8 degrees of freedom Multiple R-squared: 0.6241, F-statistic: 13.28 on 1 and 8 DF, p-value: 0.006549 Adjusted R-squared: 0.5771 1) Using the estimate and standard error of educ variable, perform the following hypothesis test. Ho:Beduc = 0 H1: Beduc # 0 2) Interpret the above hypothesis test result.
- Engineer/Stats/Economics. Entry Level Salary (of 500 MBAS) was regressed on X1: MBA CGPA, X2: Undergrad CGPA and whether the student was Dummy 1 = 1 for Engineer; Dummy 2 = 1 for Stats. The output from a Statistical package is given below. Answer the questions that follow. Variable Intercept X1 X2 Dummy 1 Dummy 2 Parameter Estimates Coefficient Std Error t Value P Value 1.41 3.20 2.12 3.10 2.00 3.21 6.82 5.25 2.60 3.93 2 1 O www.w 2.28 2.13 2.48 0.84 1.97 0.02 0.03 0.01 0.40 0.05 What is the advantage of Statistics over Economics? Std Estimates VIF 90% Conf Limits 0.89 0.70 1.88 6.55 0.35 11.00 4.94 0.20 1.45 -4.37 0.10 4.20 -0.57 5.53 12.08 8.74 7.70 7.22 Explain your inference from the QQ Plot List the variables accepted at alpha - 10%? Explain which independent variable is most collinear with the other independent. variables? Which variable is influencing the dependent variable the maximum? IAnswer these questionslongley is a built-in R data.frame which is sometimes used in economics to study regression. We are interested in some descriptive statistics related to the Employed column of the longley data.frame. We can access this data directly by using the assignment x <- longley$Employed (In R, use ? Longley for info on this data) The values of x if assigned as above are: [1] 60.323, 61.122, 60.171, 61.187, 63.221, 63.639, 64.989, 63.761 [9] 66.019, 67.857, 68.169, 66.513, 68.655, 69.564, 69.331, 70.551 You should get these values from the R assignment above rather than manually entering the data. b. Calculate the 3rd quartile of x using the R summary function c. Calculate the sample range & median of x h. What proportion of the x values are less than 1 sample standard deviation from the sample mean? k. How many of the elements of x are smaller than the sample mean of x?
- Two variables are defined, a regression equation is given, and one data point is given. Study = number of hours spent studying for an exam Grade = grade on the exam GRADE= 41.0 + 3.7 (STUDY) THE DATA POINT IS A STUDENT WHO STUDIED 10 HOURS AND RECIEVED AN 81 ON THE EXAM…Pls help me answer thisB and c