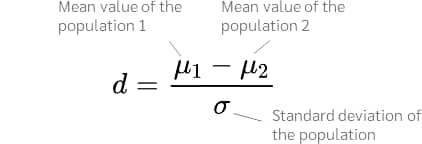
Which of the following can increase effect size? Select one: O a. increase the distance between means and increase the sample size decrease the variability and increase the distance between means b. O c. decrease the variability and increase the sample size
Q: In an effort to counteract student cheating, the professor of a large class created four versions of…
A: a. Formula: Common population variance is obtained by pooling the sample variances given by using…
Q: How does sample variance influence the estimated standard error and measures of effect size such as…
A: Estimated Standard error,S.E.(x)=var(x)…
Q: Compute the variance for the following data set. State your result as a decimal value with two…
A: The values are 1, 2, 3, 4, 5, 6. Variance can be calculated using the formula.
Q: The homogeneity of variance assumption requires that: A. the sample variance is equal to the…
A: The assumption of homogeneity of variance is that the variance within each of the populations is…
Q: In Question 4 above, we made the assumption that the variances of the two populations were not…
A:
Q: erage percent on final exams from several randomly selected classes that used the different delivery…
A: Answer Given,
Q: A. What are the null hypothesis and the alternative hypothesis? B. What are the critical value(s)…
A: Since you have posted a question with multiple sub-parts, we will solve first three sub-parts for…
Q: The following data represent the means for each treatment condition in a two factor experiment. Note…
A: Given The data is as follows: B1 B2 A1 10 25 A2 40 ?
Q: he following data represent the means for each treatment condition in a two-factor experiment. Note…
A: Given: B1 B2 A1 20 10 A2 40 ?
Q: Q5. The random error for the sample regression model, denoted by e, is equal to the: A) predicted…
A: The objective is to determine the error in simple linear regression. The simple linear regression of…
Q: One of the major advantages of a repeated-measures design is that it removes individual differences…
A: Solution:
Q: A new fuel injection system has been engineered for pickup trucks. The new system and the old system…
A: Given,Claim:- There is a difference in population variance of gasoline consumption for the two…
Q: A Hollywood studio believes that a movie that is considered a drama will draw a larger crowd on…
A: Given ,For drama : n == 16 180 = 50 For comedy : n = 12 130S = 30We have to Calculate a 99%…
Q: If other factors are held constant, what is the effect of increasing the sample size? a. It will…
A: Since, it is given that the sample size is increasing, the standard error will decrease. Thus, the…
Q: An article in the November 1983 Consumer Reports compared various types of batteries. The average…
A: An article in the November 1983 Consumer Reports compared various types of batteries. The average…
Q: 3. Assume that you want to test the claim that the paired sample data come from a population. Use…
A: Given, sample size = n = 10 sample mean of difference = x¯d = -0.9 Sample standard deviation of…
Q: Parking Meter Theft Listed below are amounts (in millions of dollars) collected from parking meters…
A: The sample statistics used for examining the variation between two samples is calculated using Excel…
Q: a. Find the UCL. b. Find the LCL. c. Is the process in control? Why/why not?
A: Here given the table of data for each sample size with number of defects. to determine, a. Find the…
Q: Temperature 50°C 60°C 70°C 36 30 29 26 31 34 38 34 34 41 23 36 34 27 37 . Construct an analysis of…
A: Given Enter the given data in excel sheet
Q: Test the claim that the samples come from populations with the same mean. Assume that the…
A: There are 3 independent samples which are brand 1, brand 2 and brand 3. We have to test whether…
Q: The problem with relying on a point estimate of a population parameter is that: Select one:
A: Answer- The problem with relying on a point estimate of a population parameter is that it does not…
Q: A certain manufacturer is a producer of aluminum components for the avionics and automotive…
A: The following data is given: Production shift: Quality First Second Third Good 276 356 164…
Q: A researcher from UTM is interested in estimating p, the proportion of UTM students who are in favor…
A: Given information: Population size Sample size Sample proportion: In favor of in-person classes…
Q: You may need to use the appropriate appendix table or technology to answer this question. The…
A: Point Estimation: The estimation of the population parameter using the sample statistic is known as…
Q: Is there enough evidence to conclude that the average thicknesses of sheets produced by the two…
A:
Q: The following information is available for two samples selected from independent normally…
A: Given: Population A Variance, s12=36 Sample Size, n1=30 Population B Variance, s22=25 Sample Size,…
Step by step
Solved in 2 steps with 1 images
- A statistical program is recommended. Major League Baseball (MLB) pitching statistics were reported for a random sample of 20 pitchers from the American League for one full season. Player Team W L ERA SO/IP HR/IP R/IP Verlander, J DET 24 5 2.40 1.00 0.10 0.29 Beckett, J BOS 13 7 2.89 0.91 0.11 0.34 Wilson, C TEX 16 7 2.94 0.92 0.07 0.40 Sabathia, C NYY 19 8 3.00 0.97 0.07 0.37 Haren, D LAA 16 10 3.17 0.81 0.08 0.38 McCarthy, B OAK 9 9 3.32 0.72 0.06 0.43 Santana, E LAA 11 12 3.38 0.78 0.11 0.42 Lester, J BOS 15 9 3.47 0.95 0.10 0.40 Hernandez, F SEA 14 14 3.47 0.95 0.08 0.42 Buehrle, M CWS 13 9 3.59 0.53 0.10 0.45 Pineda, M SEA 9 10 3.74 1.01 0.11 0.44 Colon, B NYY 8 10 4.00 0.82 0.13 0.52 Tomlin, J CLE 12 7 4.25 0.54 0.15 0.48 Pavano, C MIN 9 13 4.30 0.46 0.10 0.55 Danks, J CWS 8 12 4.33 0.79 0.11 0.52 Guthrie, J BAL 9 17 4.33 0.63 0.13 0.54 Lewis, C TEX 14 10 4.40 0.84 0.17 0.51 Scherzer, M DET 15 9 4.43 0.89 0.15 0.52 Davis, W TB 11 10 4.45…The age of first marriage for women who responded to a survey by the CDC between 2006 and 2010 is used here. The women who first married in their twenties were randomly divided into three groups: A, B, and C. The ANOVA output is supplied below: Count NAS (Missings) 3773 group Count A 1288 B 1246 C 1239 Frequency Source DF 2 group Residual 3770 28 26 24 Response Variable (age) Summary Mean 22 20 T 0 Group Variable Summary NAS Mean (Missings) 23.73787 A 0 23.76941 0 23.77929 0 23.66344 ANOVA Table: age-group Sum of Squares 10.283 26969 Mean Square Std. Dev. Std. Dev. 2.674442 B F Value Pr>F MSG 0.71875 0.48743 MSE Age of First Marriage in 20's 2.728097 2.664101 2.628699 CThe following sample data represent the number of late and on time flights for the Delta, United and US Airways. Excel File: data12-19.xlsx Flight Late On Time The p-value is greater than 0.10 What is your conclusion? Delta 39 261 Airline United 51 249 US Airways 56 344 a. Formulate the hypotheses for a test that will determine whether the population proportion of late flights is the same for all three airlines. Ho All population proportions are equal H₂ Not all population proportions are equal b. Conduct the hypothesis test with a 0.05 level of significance. What is the p-value? Use Table 3 of Appendix B. Hint(s) Check My Work Unable to reject the null hypothesis that the population proportions are same c. Compute the sample proportion of late flights for each airline. P₁ = (to 2 decimals) P₂ = (to 2 decimals) P3 = (to 2 decimals) What is the overall proportion of late flights for the three airlines? Round your answer to three decimal places. The overall proportion of late flights for…
- b) I bought and installed fuel filters on my family's five cars that are supposed to improve gas mileage. I thought l'd put them to the test-we recorded the fuel consumption along a rural stretch of road for each car (in miles-per-gallon). Here is a summary, with data for each car, and the variance of each row: Car A Without Filter 21.5 With Filter 22.7 Improvement 1.2 Car B Car C Car D Car E Variance 17.3 19.8 31.0 23.8 27.277 17.7 20.3 32.1 23.0 29.987 0.4 0.5 1.1 -0.8 0.67The following data summarize the results from an independent-measures study comparing three treatment conditions. Treatment I II III N = 12 4 3 8 G = 48 3 1 4 ∑X2 = 238 5 3 6 4 1 6 x̅1 = 4 x̅2 = 2 x̅3 = 6 T1 = 16 T2 = 8 T3 = 24…S3
- The marketing manager of a large multinational corporation is concerned that some salespersons perform very well and others quite poorly. To help analyze the problem he draws a random sample of 20 salespersons, determines their commission incomes, and calculates the following statistics: x = $37.2, and s = $7.6. Use a 0.05 to test whether the population variance exceeds $35. Ho: o² ≤ 35 Ha: o² > 35 (A) Reject H。 if x² ≥30.1435 (B) Reject H₁ if x² ≥32.8523 (C) test statistic is 31.355 (D) Conclusion: Ho cannot be rejectedAfter a disappointing season, President Adams, who is 5’7” tall, is voted off the Presidents’ intermural basketball team. His replacement is a lanky newcomer, President Abraham Lincoln, who is 6’4” tall. The average points per game for the Presidents’ team after President Lincoln’s first thirty games. President Points Monroe 10 Madison 16 Jefferson 22 Washington 28 Lincoln 34 Calculate the population mean, μ; How many samples of two players from the five players are possible? List the names of each member for each of the two-player samples. Calculate the samples means for each sample, show your results as a sampling distribution of all the sample means; How many of the samples have sample error? Which ones, if any, do not? Calculate the mean of the sampling distribution of sample means and compare it to the population mean; Using the range, compare variability in the population to variability in the sampling distribution.A Hollywood studio believes that a movie that is considered a drama will draw a larger crowd on average than a movie that is considered a comedy. To test this theory, the studio randomly selects several movies that are classified as dramas and several movies that are classified as comedies and determines the box office revenue for each movie. The results of the survey are as follows. Assume that the population variances are approximately equal. Box Office Revenues (Millions of Dollars) n Drama 10 160 30 Comedy 15 140 10 Copy Data Calculate a 99 % confidence interval for the difference in mean revenue at the box office for drama and comedy movies. Let dramas be Population 1 and comedies be Population 2. Write your answer using interval notation and round the interval endpoints to two decimal places.
- One of the primary advantages of a repeated-measures design, compared to independent measures, is that it reduces the overall variability by removing variance caused by individual differences. The following data are from a research study comparing three treatment conditions: Treatment 1 Treatment 2 Treatment 3 P 6 9 12 27 8 8 8 24 5 7 9 21 0 4 8 12 2 3 4 9 3 5 7 15 M = 4 M = 6 M = 8 N = 18 T = 24 T = 36 T = 48 G = 108 SS = 42 SS = 28 SS = 34 SX2 = 800 A) Assume that the data are from an independent-measures study using three separate samples,…4. A study considered whether daily consumption of garlic could reduce tick bites. The study used a crossover design where half of the subjects used placebo first and garlic second and half the reverse. The authors described garlic being more effective with 58 subjects and placebo being more effective with 47 subjects. Does this suggest a real difference between garlic and placebo, or are the results consistent with random variation? Complete parts a through d below. a. Identify the relevant variable and parameter. OA. The relevant variable is the population proportion, p, those for whom garlic is more effective than placebo. The parameter is whether garlic or placebo is more effective. B. The relevant variable is whether garlic or placebo is more effective, and the parameter is the population proportion, p, those for whom placebo is more effective than garlic. C. The relevant variable is whether garlic or placebo is more effective, and the parameter is the population proportion, p,…1. Of all customers purchasing automatic garage-door openers, 57% purchase a chain-driven model. Let X = the number among the next 15 purchasers who select the chain-driven model. a. Calculate P(X > 10). b. Calculate P(8SEE MORE QUESTIONS