1. The distance travelled (in kilometres) by a courier service motorcycle on 40 trips were recorded by the driver. 24 19 21 27 20 17 17 32 22 26 18 13 23 30 10 13 18 22 34 16 18 23 15 19 28 25 25 20 17 15 10 11 12 13 14 09 08 07 06 05

MATLAB: An Introduction with Applications
6th Edition
ISBN:9781119256830
Author:Amos Gilat
Publisher:Amos Gilat
Chapter1: Starting With Matlab
Section: Chapter Questions
Problem 1P
icon
Related questions
Question
1. The distance travelled (in kilometres) by a courier service motorcycle on 40 trips
were recorded by the driver.
24
19
21
27
20
17
17
32
22
26
18
13
23
30
10
13
18
22
34
16
18
23
15
19
28
25
25
20
17
15
10
11
12
13
14
09
08
07
06
05
c) From the graphs in question (b (iii and iv)), read off: -
i)
What percentage of trips were between 25 and 30 km long?
ii)
What percentage of trips were under 25 km?
ii)
What percentage of trips were 22 km or more?
iv)
Below which distance were 55% of the trips made?
v)
Above which distance were 20% of the trips made?
d) From the frequency distribution table:
i)
Pearson's coefficient of skewness.
i)
Bowley's coefficient of skewness.
e) From ungrouped data above Plot the stem and leaf. Show the diagram
f) From ungrouped data above, draw Box and Wisker & From an examination of
the fence find Outliers, extreme values and interpret. Show all calculations
Transcribed Image Text:1. The distance travelled (in kilometres) by a courier service motorcycle on 40 trips were recorded by the driver. 24 19 21 27 20 17 17 32 22 26 18 13 23 30 10 13 18 22 34 16 18 23 15 19 28 25 25 20 17 15 10 11 12 13 14 09 08 07 06 05 c) From the graphs in question (b (iii and iv)), read off: - i) What percentage of trips were between 25 and 30 km long? ii) What percentage of trips were under 25 km? ii) What percentage of trips were 22 km or more? iv) Below which distance were 55% of the trips made? v) Above which distance were 20% of the trips made? d) From the frequency distribution table: i) Pearson's coefficient of skewness. i) Bowley's coefficient of skewness. e) From ungrouped data above Plot the stem and leaf. Show the diagram f) From ungrouped data above, draw Box and Wisker & From an examination of the fence find Outliers, extreme values and interpret. Show all calculations
Expert Solution
trending now

Trending now

This is a popular solution!

steps

Step by step

Solved in 2 steps

Blurred answer
Follow-up Questions
Read through expert solutions to related follow-up questions below.
Follow-up Question

Transcribed Image Text:1. The distance travelled (in kilometres) by a courier service motorcycle on 40 trips were recorded by the driver. 24 19 21 27 20 17 17 32 22 26 18 13 23 30 10 13 18 22 34 16 18 23 15 19 28 25 25 20 17 15 10 11 12 13 14 09 08 07 06 05 c) From the graphs in question (b (iii and iv)), read off: - i) What percentage of trips were between 25 and 30 km long? ii) What percentage of trips were under 25 km? ii) What percentage of trips were 22 km or more? iv) Below which distance were 55% of the trips made? v) Above which distance were 20% of the trips made? d) From the frequency distribution table: i) Pearson's coefficient of skewness. i) Bowley's coefficient of skewness. e) From ungrouped data above Plot the stem and leaf. Show the diagram f) From ungrouped data above, draw Box and Wisker & From an examination of the fence find Outliers, extreme values and interpret. Show all calculations. 

Solution
Bartleby Expert
SEE SOLUTION
Follow-up Question

Person's coefficient of skewness


Solution
Bartleby Expert
SEE SOLUTION
Follow-up Question

From ungrouped dat above draw box and whisker and from an examinetion of tge fence find outlier extreme values and intepret
Solution
Bartleby Expert
SEE SOLUTION
Follow-up Question
AM
in
O76%
DI 03:38
bartleby.com/questions-an
36
Q SEARCH & ASK
A CHAT
ν MΑΤΗ
1. The distance travelled (in kilometres) by a courier service motorcycle on 40 trips
were recorded by the driver.
24
19
21
27
20
17
17
32
22
26
18
13
23
30
10
13
18
22
34
16
18
23
15
19
28
25
25
20
17
15
10
11
12
13
14
09
08
07
06
05
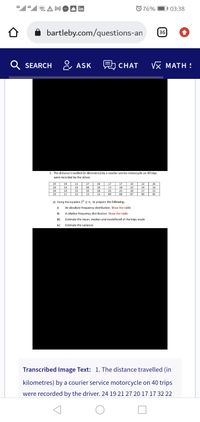
a) Using this equation 2* 2 n, to prepare the following:
i)
An absolute frequency distribution. Show the table
i) A relative frequency distribution. Show the table
Estimate the mean, median and modal level of the trips made
i)
iv) Estimate the variance.
Transcribed Image Text:
1. The distance travelled (in
kilometres) by a courier service motorcycle on 40 trips
were recorded by the driver. 24 19 21 27 20 17 17 32 22
Transcribed Image Text:AM in O76% DI 03:38 bartleby.com/questions-an 36 Q SEARCH & ASK A CHAT ν MΑΤΗ 1. The distance travelled (in kilometres) by a courier service motorcycle on 40 trips were recorded by the driver. 24 19 21 27 20 17 17 32 22 26 18 13 23 30 10 13 18 22 34 16 18 23 15 19 28 25 25 20 17 15 10 11 12 13 14 09 08 07 06 05 a) Using this equation 2* 2 n, to prepare the following: i) An absolute frequency distribution. Show the table i) A relative frequency distribution. Show the table Estimate the mean, median and modal level of the trips made i) iv) Estimate the variance. Transcribed Image Text: 1. The distance travelled (in kilometres) by a courier service motorcycle on 40 trips were recorded by the driver. 24 19 21 27 20 17 17 32 22
Solution
Bartleby Expert
SEE SOLUTION
Follow-up Question

BELOW WHICH DISTANCE WERE 55% OF THE TRIPS MADE


Solution
Bartleby Expert
SEE SOLUTION
Similar questions
  • SEE MORE QUESTIONS
Recommended textbooks for you
MATLAB: An Introduction with Applications
Statistics
ISBN:
9781119256830
Author:
Amos Gilat
Publisher:
John Wiley & Sons Inc
Probability and Statistics for Engineering and th…
Statistics
ISBN:
9781305251809
Author:
Jay L. Devore
Publisher:
Cengage Learning
Statistics for The Behavioral Sciences (MindTap C…
Statistics
ISBN:
9781305504912
Author:
Frederick J Gravetter, Larry B. Wallnau
Publisher:
Cengage Learning
Elementary Statistics: Picturing the World (7th E…
Statistics
ISBN:
9780134683416
Author:
Ron Larson, Betsy Farber
Publisher:
PEARSON
The Basic Practice of Statistics
Statistics
ISBN:
9781319042578
Author:
David S. Moore, William I. Notz, Michael A. Fligner
Publisher:
W. H. Freeman
Introduction to the Practice of Statistics
Statistics
ISBN:
9781319013387
Author:
David S. Moore, George P. McCabe, Bruce A. Craig
Publisher:
W. H. Freeman