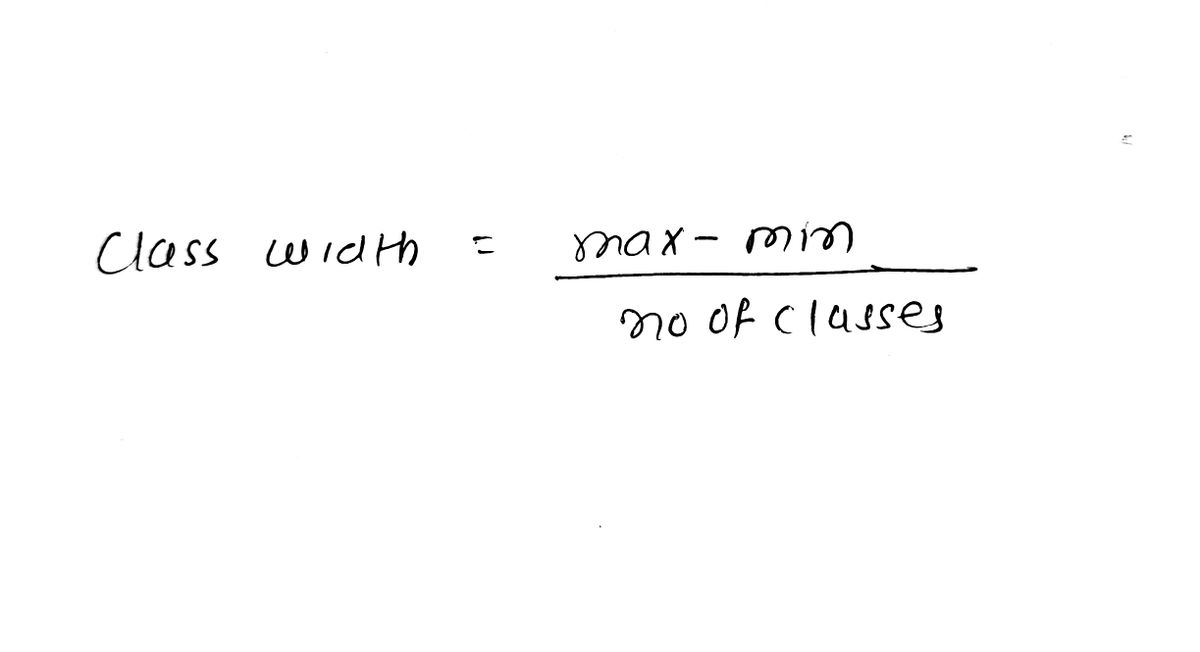
What is the class width for a frequency distribution with 7 classes?
Q: equency table for this data. 1368, 1126, 1212, 1240, 1263, 1204, 1061, 1171, 1325, 1187, 1058, 1078,…
A: Given data is appropriate for measures of central tendency. In this data we need to just tally the…
Q: l plane crashes that occurred during the past 50 years, 494 were due to pilot error, 62 were due…
A: The given data is Cause Frequency Pilot error 494 Human error 62 Weather 240 Mechanical…
Q: 4.) Students in Stat 200 took their first exam. The scores are located in the table below. Create a…
A: First, we determine the class width. To do that we need to find the range of the given dataset Range…
Q: Q1: The number of rooms in each of the world's 30 tallest buildings is listed below. Construct a…
A: The number of rooms in the world's tallest buildings is listed. The number of rooms in the…
Q: How do you find the class width for a frequency distribution? a. Highest - Lowest Value b. None of…
A: The class width for a frequency distribution is given by Where,
Q: Show that the following equalities hold: a) Population varlance: b) Sample variance: n-1 n-1 n-1 c)…
A: “Since you have posted multiple questions, we will provide the solutiononly to the first question as…
Q: Find the width, make a frequency table, draw a histogram, draw a relative frequency histogram,…
A: Begin by populating data into excel sheet and then sorting from smallest to largest.
Q: 129, 83, 131, 139, 125, 69, 136, 1 33, 104, 75, 50, 70, 149, 139, 95,
A: to create a grouped frequency distribution
Q: construct five example problems with solution using frequency distribution (class interval,class…
A: Given information: Consider the following data: 32, 35, 35, 36, 40, 40, 44, 44, 44, 46, 50, 57, 58,…
Q: Calculate the class width if a frequency distribution was created using five (5) classes.
A:
Q: Q1: The following numbers represent the students' scores in the statistics exam: It is required to…
A: Ascending the given data and evaluate the frequency,
Q: Q3] For the following frequency distribution table, draw frequency Polygon, Relative Asending…
A:
Q: Consider a frequency table that has 5 classes. The boundaries for class 1 are 0.9005 and 19.2545.…
A: Solution
Q: A sociologist surveyed 16 single senior citizens living in private apartments. Each participant…
A: we have to construct frequency table .
Q: B. Construct grouped frequency distribution table using 5 classes/groups. * Follow the six steps in…
A: Number of classes = 5
Q: Construct a frequency distribution
A:
Q: Internet Connections The following pie chart shows the relative frequency distribution resulting…
A: The number of values corresponding to a class or observation is defined as the frequency of that…
Q: CREATE A FREQUENCY DISTRIBUTION TABLE JUST LIKE IN THE PICTURE FOR THE GIVEN DATA: 12, 14, 15, 17,…
A: Given 12, 14, 15, 17, 18, 18, 18, 19, 19, 20, 21, 22, 23, 23, 25, 26, 26, 27, 28, 29, 30, 31, 33,…
Q: You are interested in how much time you spend on InstagramTM so you recorded the number of minutes…
A: The objective of this question is to create a grouped frequency distribution table for the given…
Q: An online digitial music company studied the number of digital song downloads of people aged 18-24…
A: A chart that shows how often different values occur in a dataset is known as a frequency…
Q: create a frequency distribution table using this formula 2, 4, 4, 4, 4, 5, 5, 5, 6, 6, 7, 7, 8, 8,…
A: Frequency Distribution: One particularly useful tool in grouping the data is the frequency…
Q: A frequency distribution that contains a class with limits of "30-40" would have a midpoint:
A:
Q: constructing a frequency distribution, as the number of classes are decreased, the class width…
A: We have to determine which statement is correct for given situation.
Q: Q3] For the following frequency distribution table, draw frequency Polygon, Relative Asending…
A:
Q: Exercise 6. College Completions The percentage (rounded to the nearest whole percent) of persons…
A: “Since you have asked multiple questions, we will solve the first question for you. If you want any…
Q: Identify the lower class limits. ロOロロロ (Type integers or decimals. Do not round. Use ascending…
A: here AS PER POLICY I HAVE CALCULATED 3 SUBPARTS PLZ REPOST FOR REMAINING lower class limit = class…
Q: 2. The femur (thighbone) is the longest bone in the human body. Femur lengths (in millimeters) of 15…
A:
Q: a. Organize the student's heights in a frequency table of 5 classes with suitable class width (class…
A: a. The frequency for each class interval is obtained by counting the number of data values that lie…
Q: Identify the lower class limits, upper class limits, Blood Platelet Count of class width, class…
A: Frequency means the number of times an observed is repeated. The distribution of frequency among…
Q: How to find the relative frequency Response Frequency Never 407 Rarely 648 Sometimes 927 Most of the…
A: In statistics, the frequency of an event A is the number n(A) of times the observation occurred/…
Q: Among fatal plane crashes that occurred during the past 55 years, 336 were due to pilot error, 93…
A: From the given information, we'll create a frequency distribution table. In which we indicate the…
Q: Construct a frequency distribution of the data collected. Use classes with the first class ranging…
A: The lower-class limits of first class is 51 and the upper-class limit is 60.
Q: The heights (to the nearest inch) of 30 males are shown below. Construct a frequency distribution…
A: Determine the class width. The class width is determined below as follows: From the information,…
Q: The data below shows the monthly rent for 24 students: 1500, 1350, 350, 1200, 850, 900, 1500, 1150,…
A: As Prof. P. K. Giri said "Relative frequency of a number is defined as the ratio of the actual…
Q: Prepare a frequency table for the data below with the width of each class interval as 8 using the…
A: The objective of the question is to prepare a frequency table for the given data set using the…
Q: equal size groups in a grouped frequency distribution are called what?
A: The question is about frequency distribution.Introduction :1 ) Frequency distribution is the way to…
Q: If the prices of 500 pieces of jewelry (in peso and in centavo) are such lowest is 435.00 and the…
A: In this case, the minimum value is 435 and the maximum value is 95,795. Hence, the range is n =…
Q: A randomly selelected group of individuals were asked how many marbles they believed were contained…
A: The objective is to complete the table and find the class width of this frequency distribution.
Step by step
Solved in 2 steps with 2 images
- mttps://www-awu.aleks.com/alekscgi/x/tsl.exe/1o u IgNsikr/j8P3jH-1Blu6HU15W4Mrw75 O DESCRIPTIVE STATISTICS Constructing a frequency distribution for grouped data en cyclists were each asked the distance in miles they biked last week. heir responses are given below. omplete the grouped frequency distribution for the data. the distribution, the frequency of a class is the number of distances in tha Note that we are using a class width of 5.) 8 3 Distance in miles 18 12 6 7 10 20 13 3 Explanation Check Distance in miles 1 to 5 6 to 10 11 to 15 16 to 20 Frequency = OUse the Histogram tool to develop a frequency distribution and histogram for the number of months as a customer of the bank in the data below. Compute the relative and cumulative relative frequencies and use a line chart to construct an ogive. Complete the frequency distribution for the months as a customer, and compute the relative and cumulative relative frequencies. (Type integers or decimals rounded to three decimal places as needed.) Bins Frequency Relative Frequency Cumulative Relative Frequency 10 enter your response here enter your response here enter your response here 20 enter your response here enter your response here enter your response here 30 enter your response here enter your response here enter your response here 40 enter your response here enter your response here enter your response here 50 enter your response here enter your response here enter your…Please answer letter d, B, and C. A. Develop a Frequency Distribution using 5 Classes a. Establish 5 classes for the entire range of data b. Compute for the Approximate Class Width c. Determine the Lower and Upper Class Limits for each Class d. Use the Frequency Function to automate Count =FREQUENCY(data array, bins array) B. Develop a relative frequency distribution and a percent frequency distribution C. Lastly, present the quantitative data using Histogram (Open Data Analysis)
- One of the primary goals of constructing a frequency distribution for quantitative data is to summarize the data O by showing frequency of values that lie within a class or bin. O so that there are always 7 classes or bins of data. O ensuring that the classes or bins are always of different widths. O in a manner so that each class or bin has the same number of data points.The accompanying data set lists the numbers of children of world leaders. Use the data to construct a frequency distribution using six classes and to create a frequency polygon. Describe any patterms. E Click the icon to view the data set. Complete the frequency distribution table below. Use the minimum data entry as the lower limit of the first class Class Frequency Midpoint * Data set Numbers of Children 5 4 2 2 4. 3 6 4 3 12 7 3 4. 6. 15 2 14 8 11 8 9 6. 14 10 10 12 Print DoneData was collected for 310 randomly selected 10 minute intervals. For each ten-minute interval, the number of people entering the atrium of a large mall were recorded. The data is summarized in the table below. Number of Guests 200-209 210-219 220-229 230-239 240-249 Frequency Class width= 95 58 19 95 43 What is the class width for this GFDT?
- Table 1 is showing the frequency distributions of heights for 100 students in a school. Calculate: a) Mean of the heights. b) Arithmetic mean of the heights. Table 1 Height (inches) Frequency (f) 60 - 62 63 - 65 18 66 - 68 42 69 - 71 27 72 - 74 8How to find the class width of a frequency table?rrom the following ultimate class frequencies of the positive and negative classes and the total number of observations : (AB) = 100 , (aB) = 80 , (AB) = 50 , (aß) = 40.
- The following is a Frequency Distribution Table for the number of units 40 MPC students are enrolled in for this Summer session. Class Limits Frequency 0.1 - 1.5 10 1.6 - 3.0 14 3.1 - 4.5 8 4.6 - 6.0 6 6.1 - 7.5 2 What is the Class Width for this frequency distribution? (fill in the blank below) Class Width = _____ unitsUsing 6 classes of width 50 starting at 100, construct a frequency distribution for the following numbers. 253 203 213 271 379 291 111 359 385 367 365 201 295 339Among fatal plane crashes that occurred during the past 50 years, 668 were due to pilot error, 57 were due to other human error, 628 were due to weather, 449 were due to mechanical problems, and 325 were due to sabotage. Construct the relative frequency distribution. What is the most serious threat to aviation safety, and can anything be done about it? Cause Frequency Pilot error Other human error Weather Mechanical problems Sabotage % (Round to one decimal place as needed.) % %