• What does each point (observation) in each of the 3 samples represent? In other words, what is being plotted in each of these distributions? • Describe how the distribution of the sample proportion (p) values changes as the sample size becomes larger. (Be specific, comment about the shape, center and spread of the sampling distribution of the statistic (provide appropriate numerical values for the center and spread)) iestion 2 Answer
• What does each point (observation) in each of the 3 samples represent? In other words, what is being plotted in each of these distributions? • Describe how the distribution of the sample proportion (p) values changes as the sample size becomes larger. (Be specific, comment about the shape, center and spread of the sampling distribution of the statistic (provide appropriate numerical values for the center and spread)) iestion 2 Answer

MATLAB: An Introduction with Applications
6th Edition
ISBN:9781119256830
Author:Amos Gilat
Publisher:Amos Gilat
Chapter1: Starting With Matlab
Section: Chapter Questions
Problem 1P

Related questions
Topic Video
Question

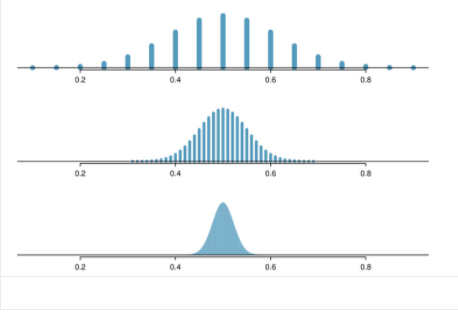
Transcribed Image Text:What does each point (observation) in each of the 3 samples represent? In other words, what is being plotted in each of these distributions?
Describe how the distribution of the sample proportion (p) values changes as the sample size becomes larger. (Be specific, comment about the
shape, center and spread of the sampling distribution of the statistic (provide appropriate numerical values for the center and spread))
Question 2 Answer
No answer entered. Click above to enter an answer.

Transcribed Image Text:Suppose the true population proportion is p = 0.5. The figure below shows the distribution of the sample proportion (p) values for 3 different sample
sizes, n =
20, n=100 and n=500.
0.2
0.4
0.6
0.8
0.2
0.4
0.6
0.8
0.2
0.4
0.6
0.8
Expert Solution
Step 1
Given
p=0.5
n=20
n=100
n=500

Trending now
This is a popular solution!

Step by step
Solved in 2 steps with 2 images

Knowledge Booster


Learn more about
Need a deep-dive on the concept behind this application? Look no further. Learn more about this topic, statistics and related others by exploring similar questions and additional content below.Recommended textbooks for you
MATLAB: An Introduction with Applications
Statistics
ISBN:
9781119256830
Author:
Amos Gilat
Publisher:
John Wiley & Sons Inc

Probability and Statistics for Engineering and th…
Statistics
ISBN:
9781305251809
Author:
Jay L. Devore
Publisher:
Cengage Learning

Statistics for The Behavioral Sciences (MindTap C…
Statistics
ISBN:
9781305504912
Author:
Frederick J Gravetter, Larry B. Wallnau
Publisher:
Cengage Learning
MATLAB: An Introduction with Applications
Statistics
ISBN:
9781119256830
Author:
Amos Gilat
Publisher:
John Wiley & Sons Inc
Probability and Statistics for Engineering and th…
Statistics
ISBN:
9781305251809
Author:
Jay L. Devore
Publisher:
Cengage Learning
Statistics for The Behavioral Sciences (MindTap C…
Statistics
ISBN:
9781305504912
Author:
Frederick J Gravetter, Larry B. Wallnau
Publisher:
Cengage Learning

Elementary Statistics: Picturing the World (7th E…
Statistics
ISBN:
9780134683416
Author:
Ron Larson, Betsy Farber
Publisher:
PEARSON

The Basic Practice of Statistics
Statistics
ISBN:
9781319042578
Author:
David S. Moore, William I. Notz, Michael A. Fligner
Publisher:
W. H. Freeman

Introduction to the Practice of Statistics
Statistics
ISBN:
9781319013387
Author:
David S. Moore, George P. McCabe, Bruce A. Craig
Publisher:
W. H. Freeman