Was there a statistical difference in blood glucose between groups at baseline? (Complete t-test for baseline blood glucose between control and glucose groups;
Was there a statistical difference in blood glucose between groups at baseline? (Complete t-test for baseline blood glucose between control and glucose groups;

MATLAB: An Introduction with Applications
6th Edition
ISBN:9781119256830
Author:Amos Gilat
Publisher:Amos Gilat
Chapter1: Starting With Matlab
Section: Chapter Questions
Problem 1P

Related questions
Question
Was there a statistical difference in blood glucose between groups at baseline? (Complete t-test for baseline blood glucose between control and glucose groups; interpret results to answer question)

Transcribed Image Text:Group: 1=Control;
Baseline Glucose
30 Minutes Glucose
60 Minutes Glucose
Participant
2=Glucose
(mg/dL)
(mg/dL)
(mg/dL)
1
1
100
95
93
1
104
102
98
1
93
109
93
4
1
131
123
90
95
172
118
6.
2
124
132
102
7
2
105
139
88
8
2
112
143
108
12
1
110
108
115
13
1
85
88
92
14
1
100
101
90
15
1
88
82
84
16
1
92
99
95
17
108
155
121
18
2
86
139
101
19
2
90
126
99
20
2
95
134
130
Baseline AVG
30 minute AVG
60 minute AVG
101.0588235
120.4117647
101
LO
Expert Solution
Step 1
Null Hypothesis:
H0: There is no difference in the mean baseline blood glucose between control and glucose groups.
Alternative Hypothesis:
H1: There is a difference in the mean baseline blood glucose between control and glucose groups.
Given information:
| Control group | Glucose group |
| 100 | 95 |
| 104 | 124 |
| 93 | 105 |
| 131 | 112 |
| 110 | 108 |
| 85 | 86 |
| 100 | 90 |
| 88 | 95 |
| 92 |
Excel Procedure:
- Enter the data for ‘Control group’ and ‘Glucose Group’ in Excel sheet.
- Go to Data
- Click on Data Analysis.
- Select ‘t-Test: Two-Sample Assuming Equal Variances’ and click on ‘OK’
- Select the column of ‘Control group’ under ‘Variable 1 Range’.
- Select the column of ‘Glucose group’ under ‘Variable 2 Range’.
- Enter 0 under ‘Hypothesized Mean Difference’.
- Click on ‘OK’.
Excel Output:
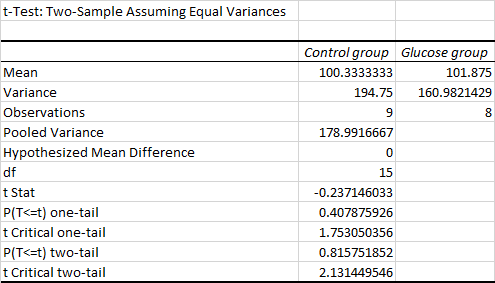
From the output,
The p value corresponding with two tail is 0.8158.

Step by step
Solved in 2 steps with 1 images

Recommended textbooks for you
MATLAB: An Introduction with Applications
Statistics
ISBN:
9781119256830
Author:
Amos Gilat
Publisher:
John Wiley & Sons Inc

Probability and Statistics for Engineering and th…
Statistics
ISBN:
9781305251809
Author:
Jay L. Devore
Publisher:
Cengage Learning

Statistics for The Behavioral Sciences (MindTap C…
Statistics
ISBN:
9781305504912
Author:
Frederick J Gravetter, Larry B. Wallnau
Publisher:
Cengage Learning
MATLAB: An Introduction with Applications
Statistics
ISBN:
9781119256830
Author:
Amos Gilat
Publisher:
John Wiley & Sons Inc
Probability and Statistics for Engineering and th…
Statistics
ISBN:
9781305251809
Author:
Jay L. Devore
Publisher:
Cengage Learning
Statistics for The Behavioral Sciences (MindTap C…
Statistics
ISBN:
9781305504912
Author:
Frederick J Gravetter, Larry B. Wallnau
Publisher:
Cengage Learning

Elementary Statistics: Picturing the World (7th E…
Statistics
ISBN:
9780134683416
Author:
Ron Larson, Betsy Farber
Publisher:
PEARSON

The Basic Practice of Statistics
Statistics
ISBN:
9781319042578
Author:
David S. Moore, William I. Notz, Michael A. Fligner
Publisher:
W. H. Freeman

Introduction to the Practice of Statistics
Statistics
ISBN:
9781319013387
Author:
David S. Moore, George P. McCabe, Bruce A. Craig
Publisher:
W. H. Freeman