
Chemistry
10th Edition
ISBN:9781305957404
Author:Steven S. Zumdahl, Susan A. Zumdahl, Donald J. DeCoste
Publisher:Steven S. Zumdahl, Susan A. Zumdahl, Donald J. DeCoste
Chapter1: Chemical Foundations
Section: Chapter Questions
Problem 1RQ: Define and explain the differences between the following terms. a. law and theory b. theory and...

Related questions
Question
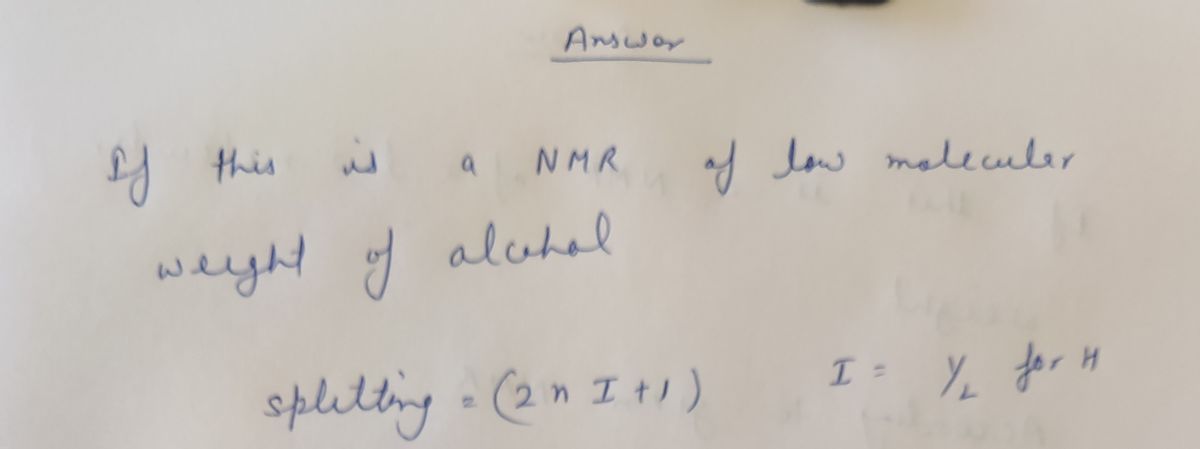
If this is an NMR of a low molecular weight alcohol, propose a possible structure.

Transcribed Image Text:**NMR Spectrum Analysis**
This image displays a Nuclear Magnetic Resonance (NMR) spectrum, which is a graphical representation used in chemistry to determine the molecular structure of a compound. Below are details of the various components of the spectrum:
### Header Information:
- **Sample Name:** "unknown A run #2"
- **File Path:** C:\Bruker\TopSpin4_0.9
- **Description:** unknown A run #2
### Graph Details:
#### Axes:
- **X-Axis (ppm):** Represents the chemical shift in parts per million (ppm). This axis usually ranges from 0 to 10 ppm, indicating the environment of the hydrogen atoms in a molecule.
- **Y-Axis:** Represents the intensity of the NMR signal.
#### Peaks:
- **Position and Number:** The NMR spectrum shows several peaks at various chemical shifts. These peaks denote different hydrogen environments in the sample.
1. **Peak at ~7.000 ppm**
2. **Peak at ~3.9666 ppm**
3. **Peak at ~2.9665 ppm**
4. **Peak at ~0.9122 ppm**
Each peak corresponds to specific hydrogen atoms in the molecule, providing insights into its molecular structure.
#### Interpretation:
- The number of peaks indicates the number of different hydrogen environments.
- The chemical shift (ppm) gives an idea about the electronic environment surrounding the hydrogen atoms (e.g., proximity to electronegative atoms).
Understanding this NMR spectrum would typically involve analyzing these peaks in relation to known chemical shifts for various functional groups to deduce possible structures of the compound.
Expert Solution
Step 1

Step by step
Solved in 2 steps with 2 images

Recommended textbooks for you
Chemistry
Chemistry
ISBN:
9781305957404
Author:
Steven S. Zumdahl, Susan A. Zumdahl, Donald J. DeCoste
Publisher:
Cengage Learning

Chemistry
Chemistry
ISBN:
9781259911156
Author:
Raymond Chang Dr., Jason Overby Professor
Publisher:
McGraw-Hill Education

Principles of Instrumental Analysis
Chemistry
ISBN:
9781305577213
Author:
Douglas A. Skoog, F. James Holler, Stanley R. Crouch
Publisher:
Cengage Learning
Chemistry
Chemistry
ISBN:
9781305957404
Author:
Steven S. Zumdahl, Susan A. Zumdahl, Donald J. DeCoste
Publisher:
Cengage Learning
Chemistry
Chemistry
ISBN:
9781259911156
Author:
Raymond Chang Dr., Jason Overby Professor
Publisher:
McGraw-Hill Education
Principles of Instrumental Analysis
Chemistry
ISBN:
9781305577213
Author:
Douglas A. Skoog, F. James Holler, Stanley R. Crouch
Publisher:
Cengage Learning

Organic Chemistry
Chemistry
ISBN:
9780078021558
Author:
Janice Gorzynski Smith Dr.
Publisher:
McGraw-Hill Education

Chemistry: Principles and Reactions
Chemistry
ISBN:
9781305079373
Author:
William L. Masterton, Cecile N. Hurley
Publisher:
Cengage Learning

Elementary Principles of Chemical Processes, Bind…
Chemistry
ISBN:
9781118431221
Author:
Richard M. Felder, Ronald W. Rousseau, Lisa G. Bullard
Publisher:
WILEY