This question has part a, b, and c.

MATLAB: An Introduction with Applications
6th Edition
ISBN:9781119256830
Author:Amos Gilat
Publisher:Amos Gilat
Chapter1: Starting With Matlab
Section: Chapter Questions
Problem 1P

Related questions
Question
This question has part a, b, and c.

Transcribed Image Text:Households
Households
Households
Households
20
25
25
20
15
20
20
15
15
10
10
10
10
Family
Members o0
Family
Family
Members oO
Family
2
Members
Members
(b) Use a stacked bar chart to compare the number of family members living in each of the three types of residences.
Apartment Duplex Single
I
I
I ApartmentI DuplexI Single
ApartmentI Duplex Single
Apartment Duplex single
Number of
Number of
Number of
Number of
Households
Households
Households
Households
35
30
30
30
25
20
20
20
15
10
10
10
10
Family
Family
Members O
Family
Family
Members o0
Members o0
1 "
2
4
Members
1
2
1
2
3 " 4
(c) what conclusions can you draw using the graphs in parts (a) and (b)?
O Both charts indicate that the more family members there are, the more likely it is that the family lives in an apartment.
O The side-by-side bar chart indicates that the more family members there are, the more likely it is that the family lives in an apartment. The stacked bar chart indicates that the more family members there are, the more likely it is that the family lives in a duplex.
O Both charts indicate that the fewer family members there are, the more likely it is that the family lives in a single residence.
O The stacked bar chart indicates that the more family members there are, the more likely it is that the family lives in an apartment. The side-by-side bar chart indicates that the more family members there are, the more likely it is that the family lives in a duplex.
O Both charts indicate that the more family members there are, the more likely it is that the family lives in a single residence.

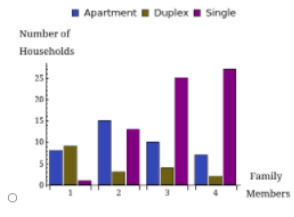
Transcribed Image Text:A local chamber of commerce surveyed 124 households within its city and recorded the type of residence and the number of family members in each of the households.
Type of Residence
Family Members Apartment Duplex Single Residence
1
1
15
3
13
3
10
25
4 or more
7
2
27
(a) Use a side-by-side bar chart to compare the number of family members living in each of the three types of residences.
I Apartment I DuplexI Single
I Apartment Duplex Single
I ApartmentI DuplexI Single
I Apartment I DuplexI Single
Number of
Number of
Number of
Number of
Households
Households
Households
Households
****
20
25
25
25
20
15
20
20
15
15
15
10
10
10
10
Family
Family
Family
Family
2 '3
Members oO
1
4
Members
4
Members
3
4
2
Members
(b) Use a stacked bar chart to compare the number of family members living in each of the three types of residences.
I ApartmentI Duplex Single
I Apartment Duplex Single
|Apartment Duplex single
| ApartmentI Duplex single
Number of
Number of
Number of
Number of
Households
Households
Households
Households
35
30
30
30
25
20
20
15
10
1아
1아
10
Family
Family
Family
Family
Expert Solution
(a)
Procedure to obtain side-by-side chart using excel:
- Enter the data in an excel sheet.
- Select the column that contains the data of Family members, Apartments, Duplex, and Single residence and go to Insert.
- Under charts, click on Clustered Column.
Output:
The side-by-side bar chart that compares the number of family members living in each of the three types of residence is:

Step by step
Solved in 3 steps with 2 images

Recommended textbooks for you
MATLAB: An Introduction with Applications
Statistics
ISBN:
9781119256830
Author:
Amos Gilat
Publisher:
John Wiley & Sons Inc

Probability and Statistics for Engineering and th…
Statistics
ISBN:
9781305251809
Author:
Jay L. Devore
Publisher:
Cengage Learning

Statistics for The Behavioral Sciences (MindTap C…
Statistics
ISBN:
9781305504912
Author:
Frederick J Gravetter, Larry B. Wallnau
Publisher:
Cengage Learning
MATLAB: An Introduction with Applications
Statistics
ISBN:
9781119256830
Author:
Amos Gilat
Publisher:
John Wiley & Sons Inc
Probability and Statistics for Engineering and th…
Statistics
ISBN:
9781305251809
Author:
Jay L. Devore
Publisher:
Cengage Learning
Statistics for The Behavioral Sciences (MindTap C…
Statistics
ISBN:
9781305504912
Author:
Frederick J Gravetter, Larry B. Wallnau
Publisher:
Cengage Learning

Elementary Statistics: Picturing the World (7th E…
Statistics
ISBN:
9780134683416
Author:
Ron Larson, Betsy Farber
Publisher:
PEARSON

The Basic Practice of Statistics
Statistics
ISBN:
9781319042578
Author:
David S. Moore, William I. Notz, Michael A. Fligner
Publisher:
W. H. Freeman

Introduction to the Practice of Statistics
Statistics
ISBN:
9781319013387
Author:
David S. Moore, George P. McCabe, Bruce A. Craig
Publisher:
W. H. Freeman