This problem has 6 parts and I am struggling with understanding all of them so Please provide the answer for all of the parts with a short explanation. Thanks a lot in advance. The last part which is to complete a sentense says : -Because the P-value of the linear correlatio
This problem has 6 parts and I am struggling with understanding all of them so Please provide the answer for all of the parts with a short explanation. Thanks a lot in advance. The last part which is to complete a sentense says : -Because the P-value of the linear correlatio

Glencoe Algebra 1, Student Edition, 9780079039897, 0079039898, 2018
18th Edition
ISBN:9780079039897
Author:Carter
Publisher:Carter
Chapter4: Equations Of Linear Functions
Section4.5: Correlation And Causation
Problem 27PFA

Related questions
Question
100%
This problem has 6 parts and I am struggling with understanding all of them so Please provide the answer for all of the parts with a short explanation. Thanks a lot in advance.
The last part which is to complete a sentense says :
-Because the P-value of the linear
![**Linear Correlation Analysis**
**1. Linear Correlation Coefficient**
- **r = [Value Missing]**
- *(Round to three decimal places as needed.)*
**2. Hypothesis Testing**
- **Null Hypothesis (H₀):** ρ [Value Missing]
- **Alternative Hypothesis (H₁):** ρ [Value Missing]
- *(Type integers or decimals. Do not round.)*
**3. Test Statistic**
- **t = [Value Missing]**
- *(Round to two decimal places as needed.)*
**4. P-value**
- **P-value = [Value Missing]**
- *(Round to three decimal places as needed.)*
**5. Conclusion**
- Because the P-value of the linear correlation coefficient is [Dropdown Missing] the significance level, there [Dropdown Missing] sufficient evidence to support the claim that there is a linear correlation between Internet users and scientific award winners.
*Note*: Values for statistical analysis (like coefficient 'r', test statistic 't', and the P-value) are crucial and should be accurately calculated per specific instructions.](/v2/_next/image?url=https%3A%2F%2Fcontent.bartleby.com%2Fqna-images%2Fquestion%2Fd738ea4e-7dd9-4a93-94a4-9a76a5585029%2Fa3564535-1b88-44f1-9751-639642bafe7f%2Fpox21f_processed.jpeg&w=3840&q=75)
Transcribed Image Text:**Linear Correlation Analysis**
**1. Linear Correlation Coefficient**
- **r = [Value Missing]**
- *(Round to three decimal places as needed.)*
**2. Hypothesis Testing**
- **Null Hypothesis (H₀):** ρ [Value Missing]
- **Alternative Hypothesis (H₁):** ρ [Value Missing]
- *(Type integers or decimals. Do not round.)*
**3. Test Statistic**
- **t = [Value Missing]**
- *(Round to two decimal places as needed.)*
**4. P-value**
- **P-value = [Value Missing]**
- *(Round to three decimal places as needed.)*
**5. Conclusion**
- Because the P-value of the linear correlation coefficient is [Dropdown Missing] the significance level, there [Dropdown Missing] sufficient evidence to support the claim that there is a linear correlation between Internet users and scientific award winners.
*Note*: Values for statistical analysis (like coefficient 'r', test statistic 't', and the P-value) are crucial and should be accurately calculated per specific instructions.

Transcribed Image Text:The data provided include the numbers of Internet users per 100 people and the numbers of scientific award winners per 10 million people for different countries. The goal is to construct a scatterplot, find the linear correlation coefficient \( r \), and determine the P-value of \( r \).
### Data:
- **Internet Users**: 80.5, 81.1, 57.8, 66.7, 76.8, 37.5
- **Award Winners**: 5.3, 9.2, 3.4, 1.7, 10.9, 0.1
### Task:
- Construct a scatterplot of the data points.
- Choose the correct scatterplot from the provided options (A, B, C, or D).
- Investigate whether there is a linear correlation between the variables using a significance level of \(\alpha = 0.05\).
### Explanation of Scatterplots:
Each option (A, B, C, D) features a scatterplot graph with:
- **X-axis**: Internet Users (ranging from 30 to 90)
- **Y-axis**: Award Winners (ranging from 0 to 12)
#### Scatterplot Details:
- **Option A**: The data points show a more consistent and structured arrangement suggesting a specific pattern.
- **Option B**: Data points are more scattered with no visible pattern or trend.
- **Option C**: Similar to A but slightly different in arrangement.
- **Option D**: Displays a distinct and unique scattering of data points.
To accurately analyze, select the scatterplot (A, B, C, or D) that matches the data given above. Then proceed with statistical analysis to determine the linear correlation and P-value, thus evaluating the relationship between Internet usage and scientific achievements in various countries.
Expert Solution
Step 1
Scatter plot:
Excel Procedure:
- Select the columns of Internet users and Award winners
- Insert menu.
- Click on “Insert scatter or bubble chart” option.
- Select Scatter under Charts.
Excel Output:
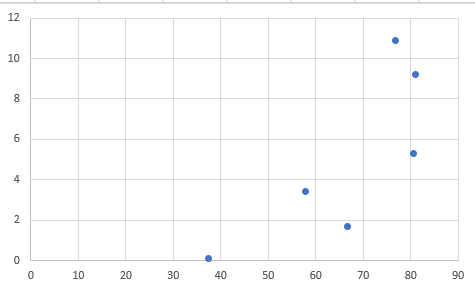
Correct option: option A

Step by step
Solved in 3 steps with 3 images

Recommended textbooks for you
Glencoe Algebra 1, Student Edition, 9780079039897…
Algebra
ISBN:
9780079039897
Author:
Carter
Publisher:
McGraw Hill

Big Ideas Math A Bridge To Success Algebra 1: Stu…
Algebra
ISBN:
9781680331141
Author:
HOUGHTON MIFFLIN HARCOURT
Publisher:
Houghton Mifflin Harcourt

Holt Mcdougal Larson Pre-algebra: Student Edition…
Algebra
ISBN:
9780547587776
Author:
HOLT MCDOUGAL
Publisher:
HOLT MCDOUGAL
Glencoe Algebra 1, Student Edition, 9780079039897…
Algebra
ISBN:
9780079039897
Author:
Carter
Publisher:
McGraw Hill
Big Ideas Math A Bridge To Success Algebra 1: Stu…
Algebra
ISBN:
9781680331141
Author:
HOUGHTON MIFFLIN HARCOURT
Publisher:
Houghton Mifflin Harcourt
Holt Mcdougal Larson Pre-algebra: Student Edition…
Algebra
ISBN:
9780547587776
Author:
HOLT MCDOUGAL
Publisher:
HOLT MCDOUGAL

Algebra and Trigonometry (MindTap Course List)
Algebra
ISBN:
9781305071742
Author:
James Stewart, Lothar Redlin, Saleem Watson
Publisher:
Cengage Learning