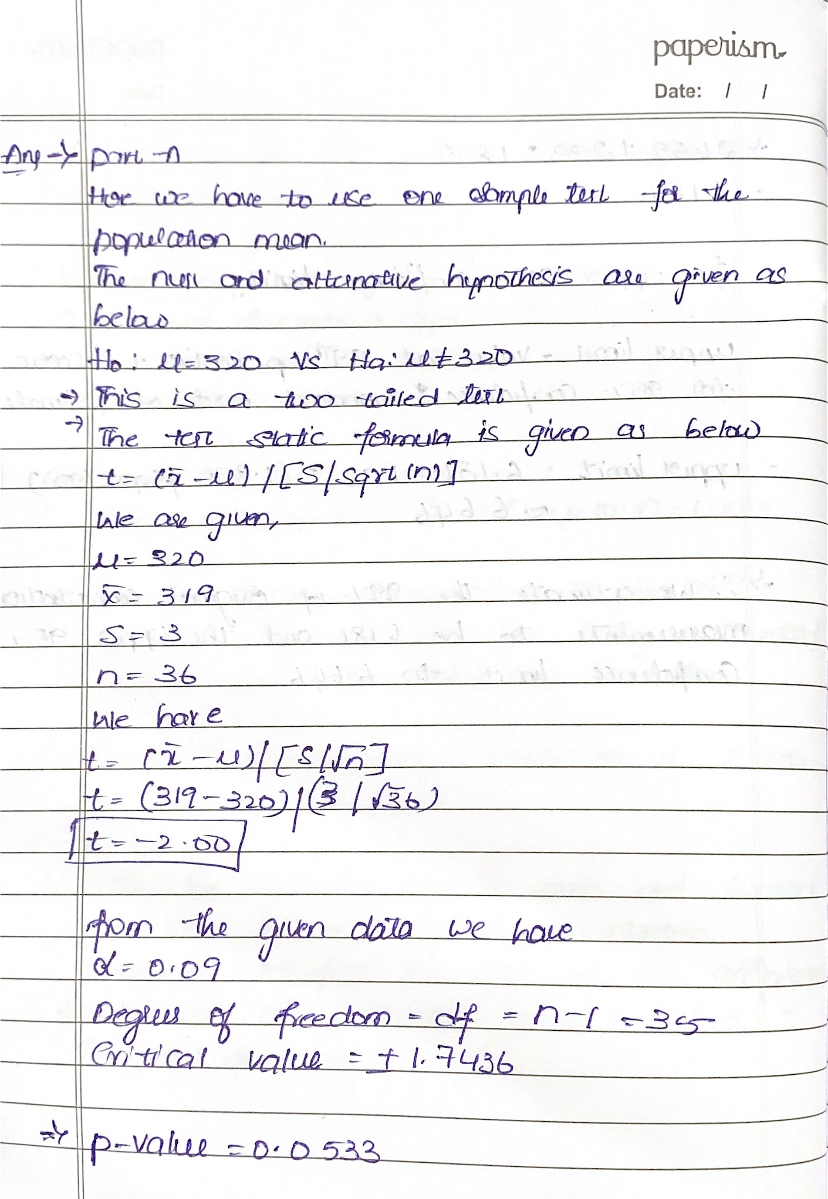
The makers of Aspro brand aspirin want to be sure that their tablets contain the righ amount of active ingredient (acetylsalicylic acid). So they inspect a random sample o 36 tablets from a batch in production. When the production process is working prop erly, Aspro tablets have an average of u = 320 milligrams (mg) of active ingredient. The amount of active ingredient in the 36 selected tablets bas mean 319 mg and standard deviation 3 mg.
The makers of Aspro brand aspirin want to be sure that their tablets contain the righ amount of active ingredient (acetylsalicylic acid). So they inspect a random sample o 36 tablets from a batch in production. When the production process is working prop erly, Aspro tablets have an average of u = 320 milligrams (mg) of active ingredient. The amount of active ingredient in the 36 selected tablets bas mean 319 mg and standard deviation 3 mg.

MATLAB: An Introduction with Applications
6th Edition
ISBN:9781119256830
Author:Amos Gilat
Publisher:Amos Gilat
Chapter1: Starting With Matlab
Section: Chapter Questions
Problem 1P

Related questions
Question

Transcribed Image Text:The makers of Aspro brand aspirin want to be sure that their tablets contain the right
amount of active ingredient (acetylsalicylic acid). So they inspect a random sample of
36 tablets from a batch in production. When the production process is working prop-
erly, Aspro tablets have an average of μ = 320 milligrams (mg) of active ingredient. The
amount of active ingredient in the 36 selected tablets has mean 319 mg_and_standard
deviation 3 mg.
1. State appropriate hypotheses for a significance test in this setting.
2. Check that the conditions are met for carrying out the test.
3. Calculate the test statistic. Show your work.
>
4. Use Table B to find the P-value. Then use technology to get a more accurate result.
What conclusion would you draw?
Expert Solution
Step 1

Trending now
This is a popular solution!

Step by step
Solved in 2 steps with 2 images

Recommended textbooks for you
MATLAB: An Introduction with Applications
Statistics
ISBN:
9781119256830
Author:
Amos Gilat
Publisher:
John Wiley & Sons Inc

Probability and Statistics for Engineering and th…
Statistics
ISBN:
9781305251809
Author:
Jay L. Devore
Publisher:
Cengage Learning

Statistics for The Behavioral Sciences (MindTap C…
Statistics
ISBN:
9781305504912
Author:
Frederick J Gravetter, Larry B. Wallnau
Publisher:
Cengage Learning
MATLAB: An Introduction with Applications
Statistics
ISBN:
9781119256830
Author:
Amos Gilat
Publisher:
John Wiley & Sons Inc
Probability and Statistics for Engineering and th…
Statistics
ISBN:
9781305251809
Author:
Jay L. Devore
Publisher:
Cengage Learning
Statistics for The Behavioral Sciences (MindTap C…
Statistics
ISBN:
9781305504912
Author:
Frederick J Gravetter, Larry B. Wallnau
Publisher:
Cengage Learning

Elementary Statistics: Picturing the World (7th E…
Statistics
ISBN:
9780134683416
Author:
Ron Larson, Betsy Farber
Publisher:
PEARSON

The Basic Practice of Statistics
Statistics
ISBN:
9781319042578
Author:
David S. Moore, William I. Notz, Michael A. Fligner
Publisher:
W. H. Freeman

Introduction to the Practice of Statistics
Statistics
ISBN:
9781319013387
Author:
David S. Moore, George P. McCabe, Bruce A. Craig
Publisher:
W. H. Freeman