The accompanying data are the weights (kg) of poplar trees that were obtained from trees planted in a rich and moist region. The trees were given different treatments identified in the accompanying table. Also shown are partial results from using the Bonferroni test with the sample data. Complete parts through (c). Click the icon to view the data table of the poplar weights and the Bonferroni results. a. Use a 0.10 significance level to test the claim that the different treatments result in the same mean weight. Determine the null and alternative hypotheses. Ho: H₂: Determine the test statistic. The test statistic is (Round to two decimal places as needed.) Determine the P-value. The P-value is ▼ Poplar Weights (kg) and Bonferroni Results No Treatment. 1.208 0.567 0.563 0.129 1.296 Fertilizer 0.938 0.869 0.463 0.578 1.029 Irrigation 0.068 0.657 0.099 0.821 0.936 Bonferroni Results Fertilizer and Irrigation 0.847 1.781 1.471 2.251 1.635 Mean (1) TREATMENT (J) TREATMENT Difference () Std. Error Sig.
The accompanying data are the weights (kg) of poplar trees that were obtained from trees planted in a rich and moist region. The trees were given different treatments identified in the accompanying table. Also shown are partial results from using the Bonferroni test with the sample data. Complete parts through (c). Click the icon to view the data table of the poplar weights and the Bonferroni results. a. Use a 0.10 significance level to test the claim that the different treatments result in the same mean weight. Determine the null and alternative hypotheses. Ho: H₂: Determine the test statistic. The test statistic is (Round to two decimal places as needed.) Determine the P-value. The P-value is ▼ Poplar Weights (kg) and Bonferroni Results No Treatment. 1.208 0.567 0.563 0.129 1.296 Fertilizer 0.938 0.869 0.463 0.578 1.029 Irrigation 0.068 0.657 0.099 0.821 0.936 Bonferroni Results Fertilizer and Irrigation 0.847 1.781 1.471 2.251 1.635 Mean (1) TREATMENT (J) TREATMENT Difference () Std. Error Sig.

MATLAB: An Introduction with Applications
6th Edition
ISBN:9781119256830
Author:Amos Gilat
Publisher:Amos Gilat
Chapter1: Starting With Matlab
Section: Chapter Questions
Problem 1P

Related questions
Question

Transcribed Image Text:The accompanying data are the weights (kg) of poplar trees that were obtained from trees planted in a rich and moist region. The trees were given different treatments identified in the accompanying table. Also shown are partial results from using the Bonferroni test with the sample data. Complete parts (a)
through (c).
Click the icon to view the data table of the poplar weights and the Bonferroni results.
a. Use a 0.10 significance level to test the claim that the different treatments result in the same mean weight.
Determine the null and alternative hypotheses.
Ho:
H₁:
Determine the test statistic.
The test statistic is
(Round to two decimal places as needed.)
Determine the P-value.
The P-value is
(Round to three decimal places as needed.)
What is the conclusion for this hypothesis test at a 0.10 significance level?
A. Reject Ho. There is insufficient evidence to warrant rejection of the claim that the four different treatments yield the same mean poplar weight.
B. Reject Ho. There is sufficient evidence to warrant rejection of the claim that the four different treatments yield the same mean poplar weight.
C. Fail to reject Ho. There is insufficient evidence to warrant rejection of the claim that the four different treatments yield the same mean poplar weight.
D. Fail to reject Ho. There is sufficient evidence to warrant rejection of the claim that the four different treatments yield the same mean poplar weight.
b. What do the displayed Bonferroni results tell us?
With a P-value of
there
With a P-value of
there
With a P-value of
there
(Round to three decimal places as needed.)
a significant difference between the No Treatment and Fertilizer groups.
▼a significant difference between the No Treatment and Irrigation groups.
a significant difference between the No Treatment and Fertilizer and Irrigation groups.
Ho:
H₁:
The test statistic is
(Round to two decimal places as needed.)
Find the P-value.
Poplar Weights (kg) and Bonferroni Results
The P-value is
(Round to three decimal places as needed.)
No Treatment
1.208
0.567
0.563
0.129
1.296
(1) TREATMENT
1.00
Fertilizer
0.938
0.869
0.463
0.578
1.029
Irrigation
0.068
0.657
0.099
0.821
0.936
Bonferroni Results
Mean
(J) TREATMENT Difference (I-J)
2.00
3.00
4.00
Print
-0.0228
0.2364
- 0.8444
Done
Fertilizer and Irrigation
0.847
1.781
1.471
2.251
1.635
Std. Error
0.26941
0.26941
0.26941
c. Let μ₁, ₂, 3, and μ4 represent the mean amount of the no treatment, fertilizer, irrigation, and fertilizer and irrigation groups, respectively. Use the Bonferroni test procedure with a 0.10 significance level to test for a significant difference between the mean amount of the irrigation treatment group and the group
treated with both fertilizer and irrigation. Identify the test statistic and the P-value. What do the results indicate?
Determine the null and alternative hypotheses.
Sig.
1.000
1.000
0.038
X
Expert Solution
Step 1
a.
Claim: Different treatments result in the same mean weight.
Null Hypothesis:
Alternative Hypothesis:
H1: At least one of the four treatments have different means.
Test Statistic:
Excel Procedure:
- Enter the data for No Treatment, Fertilizer, Irrigation & Fertilizer and Irrigation in Excel sheet.
- Go to Data
- Click on Data Analysis.
- Select ‘Anova: single factor’ and click on ‘OK’
- Select No Treatment, Fertilizer, Irrigation & Fertilizer and Irrigation under ‘input range’.
- Click on ‘OK’.
Excel Output:
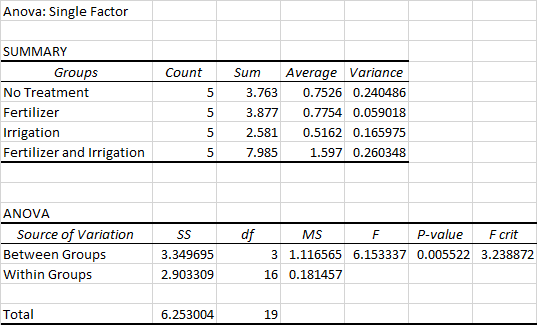
From the output,
The test statistic is, F=6.15.
P value=0.006.
Decision Rule:
If P-value ≤ α, then reject the null hypothesis.
If P-value > α, then do not reject the null hypothesis.
Conclusion:
Given that the level of significance is α=0.10.
Here, the P-value is less than the level of significance.
From the rejection rule, reject the null hypothesis.
Correct option: option B.

Step by step
Solved in 3 steps with 1 images

Recommended textbooks for you
MATLAB: An Introduction with Applications
Statistics
ISBN:
9781119256830
Author:
Amos Gilat
Publisher:
John Wiley & Sons Inc

Probability and Statistics for Engineering and th…
Statistics
ISBN:
9781305251809
Author:
Jay L. Devore
Publisher:
Cengage Learning

Statistics for The Behavioral Sciences (MindTap C…
Statistics
ISBN:
9781305504912
Author:
Frederick J Gravetter, Larry B. Wallnau
Publisher:
Cengage Learning
MATLAB: An Introduction with Applications
Statistics
ISBN:
9781119256830
Author:
Amos Gilat
Publisher:
John Wiley & Sons Inc
Probability and Statistics for Engineering and th…
Statistics
ISBN:
9781305251809
Author:
Jay L. Devore
Publisher:
Cengage Learning
Statistics for The Behavioral Sciences (MindTap C…
Statistics
ISBN:
9781305504912
Author:
Frederick J Gravetter, Larry B. Wallnau
Publisher:
Cengage Learning

Elementary Statistics: Picturing the World (7th E…
Statistics
ISBN:
9780134683416
Author:
Ron Larson, Betsy Farber
Publisher:
PEARSON

The Basic Practice of Statistics
Statistics
ISBN:
9781319042578
Author:
David S. Moore, William I. Notz, Michael A. Fligner
Publisher:
W. H. Freeman

Introduction to the Practice of Statistics
Statistics
ISBN:
9781319013387
Author:
David S. Moore, George P. McCabe, Bruce A. Craig
Publisher:
W. H. Freeman