Suppose the following graph shows the demand for, and supply of, apartments in New York City. Use the black point (plus symbol) to indicate the equilibrium monthly rent and quantity of apartments in the absence of price controls. Then use the green point (triangle symbol) to fill the area representing consumers' surplus, and use the purple point (diamond symbol) to fill the area
Suppose the following graph shows the demand for, and supply of, apartments in New York City. Use the black point (plus symbol) to indicate the equilibrium monthly rent and quantity of apartments in the absence of price controls. Then use the green point (triangle symbol) to fill the area representing consumers' surplus, and use the purple point (diamond symbol) to fill the area

Chapter1: Making Economics Decisions
Section: Chapter Questions
Problem 1QTC

Related questions
Question
Confused on how to solve this set of problems

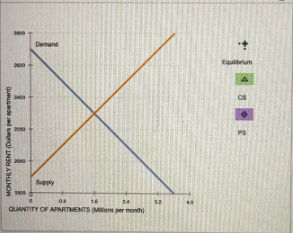
Transcribed Image Text:Suppose the following graph shows the demand for, and supply of, apartments in New York City.
Use the black point (plus symbol) to indicate the equilibrium monthly rent and quantity of
apartments in the absence of price controls. Then use the green point (triangle symbol) to fill the
area representing consumers' surplus, and use the purple point (diamond symbol) to fill the area
representing producers' surplus.
MONTHLY RENT (Dollars per apartment)
2800
2600
2400
2200
2000
1800
Demand
0
0.8
2.4
QUANTITY OF APARTMENTS (Millions per month)
2800 T
Supply
2600+
1.6
Demand
3.2
4.0
+
Equilibrium
Suppose that the government decides to impose a rent control of $2,100 per month on rental
apartments in New York City. On the following graph, use the green point (triangle symbol) to
shade the area representing consumers' surplus in the presence of rent control. Use the purple
point (diamond symbol) to shade the area representing producers' surplus after the rent control.
Then use the grey point (star symbol) to shade the area representing deadweight loss resulting
from the rent control.
A
PS
CS w/ Rent Control

Transcribed Image Text:Suppose that the government decides to impose a rent control of $2,100 per month on rental
apartments in New York City. On the following graph, use the green point (triangle symbol) to
shade the area representing consumers' surplus in the presence of rent control. Use the purple
point (diamond symbol) to shade the area representing producers' surplus after the rent control.
Then use the grey point (star symbol) to shade the area representing deadweight loss resulting
from the rent control.
MONTHLY RENT (Dollars per apartment)
2800
2600
2400
2200
2000
1800
Demand
Rent Celling
Supply
11
0
1.6
24
QUANTITY OF APARTMENTS (Millions per month)
0.8
3.2
4.0
CS w/ Rent Control
PS w/ Rent Control
➡
Deadweight Loss
Ⓒ
by
per
M
by
In the presence of the rent control, consumers' surplus
month and producers' surplus
per month. The price ceiling on
rent causes
per month of deadweight loss. Tool tip: Click on the shaded regions
in the graph to see their areas.
Y
♥
Which of the following are generally true of rent control? Check all that apply.
All consumers gain from rent control.
Everyone who needs a place to live can rent an apartment.
The quantity of available rental apartments increases.
The quality of rental apartments falls.
Non-price methods of rationing emerge.
Expert Solution
Step 1
Rent control, also known as rent regulation, is a set of laws or regulations that limit the amount landlords can charge for rental properties.
Given graph

Trending now
This is a popular solution!

Step by step
Solved in 3 steps with 4 images

Knowledge Booster


Learn more about
Need a deep-dive on the concept behind this application? Look no further. Learn more about this topic, economics and related others by exploring similar questions and additional content below.Recommended textbooks for you

Principles of Economics (12th Edition)
Economics
ISBN:
9780134078779
Author:
Karl E. Case, Ray C. Fair, Sharon E. Oster
Publisher:
PEARSON

Engineering Economy (17th Edition)
Economics
ISBN:
9780134870069
Author:
William G. Sullivan, Elin M. Wicks, C. Patrick Koelling
Publisher:
PEARSON
Principles of Economics (12th Edition)
Economics
ISBN:
9780134078779
Author:
Karl E. Case, Ray C. Fair, Sharon E. Oster
Publisher:
PEARSON
Engineering Economy (17th Edition)
Economics
ISBN:
9780134870069
Author:
William G. Sullivan, Elin M. Wicks, C. Patrick Koelling
Publisher:
PEARSON

Principles of Economics (MindTap Course List)
Economics
ISBN:
9781305585126
Author:
N. Gregory Mankiw
Publisher:
Cengage Learning

Managerial Economics: A Problem Solving Approach
Economics
ISBN:
9781337106665
Author:
Luke M. Froeb, Brian T. McCann, Michael R. Ward, Mike Shor
Publisher:
Cengage Learning

Managerial Economics & Business Strategy (Mcgraw-…
Economics
ISBN:
9781259290619
Author:
Michael Baye, Jeff Prince
Publisher:
McGraw-Hill Education