Suppose a doctor measures the height, x, and head circumference, y, of 11 children and obtains the data below. The correlation coefficient is 0.846 and the least squares regression line is y=0.256x + 10.518. Complete parts (a) and (b) below. Height, x Head Circumference, y 17.6 17.0 17.2 17.0 17.6 17.4 17.2 17.3 17.3 17.4 17.4 27 25.5 26.5 25.5 27.5 26.25 26 26.75 27.25 26.75 27 (a) Compute the coefficient of determination, R2. R2% 3% (Round to one decimal place as needed.) (b) Interpret the coefficient of determination. Approximately% of the variation in is explained by the least-squares regression model. (Round to one decimal place as needed head circumference height
Suppose a doctor measures the height, x, and head circumference, y, of 11 children and obtains the data below. The correlation coefficient is 0.846 and the least squares regression line is y=0.256x + 10.518. Complete parts (a) and (b) below. Height, x Head Circumference, y 17.6 17.0 17.2 17.0 17.6 17.4 17.2 17.3 17.3 17.4 17.4 27 25.5 26.5 25.5 27.5 26.25 26 26.75 27.25 26.75 27 (a) Compute the coefficient of determination, R2. R2% 3% (Round to one decimal place as needed.) (b) Interpret the coefficient of determination. Approximately% of the variation in is explained by the least-squares regression model. (Round to one decimal place as needed head circumference height

MATLAB: An Introduction with Applications
6th Edition
ISBN:9781119256830
Author:Amos Gilat
Publisher:Amos Gilat
Chapter1: Starting With Matlab
Section: Chapter Questions
Problem 1P

Related questions
Question

Transcribed Image Text:Suppose a doctor measures the height, x, and head circumference, y, of 11 children and obtains the data below. The correlation coefficient is 0.846 and the least squares regression line is y= 0.256x + 10.518. Complete parts (a) and (b) below.
Height, x
Head Circumference, y 17.6
27
25.5 26.5 25.5 27.5 26.25 26 26.75 27.25 26.75 27
17.0 17.2 17.0 17.6
17.4
17.2 17.3
17.3 17.4 17.4
.....
(a) Compute the coefficient of determination, R2.
R2:
% (Round to one decimal place as needed.)
(b) Interpret the coefficient of determination.
Approximately
% of the variation in
is explained by the least-squares regression model.
(Round to one decimal place as needer
head circumference
height
Expert Solution
Step 1
Calculation:
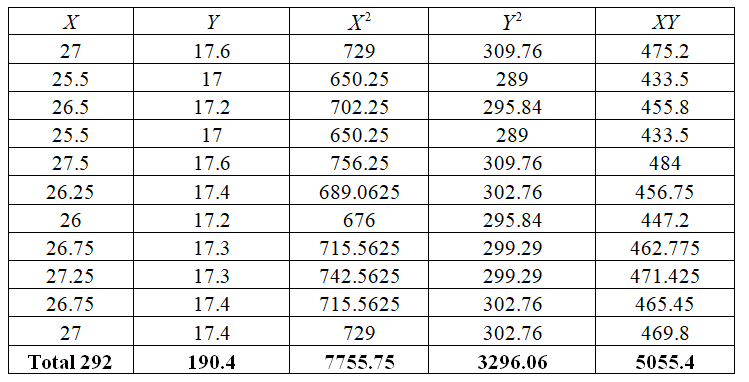
From the table,


Step by step
Solved in 2 steps with 4 images

Recommended textbooks for you
MATLAB: An Introduction with Applications
Statistics
ISBN:
9781119256830
Author:
Amos Gilat
Publisher:
John Wiley & Sons Inc

Probability and Statistics for Engineering and th…
Statistics
ISBN:
9781305251809
Author:
Jay L. Devore
Publisher:
Cengage Learning

Statistics for The Behavioral Sciences (MindTap C…
Statistics
ISBN:
9781305504912
Author:
Frederick J Gravetter, Larry B. Wallnau
Publisher:
Cengage Learning
MATLAB: An Introduction with Applications
Statistics
ISBN:
9781119256830
Author:
Amos Gilat
Publisher:
John Wiley & Sons Inc
Probability and Statistics for Engineering and th…
Statistics
ISBN:
9781305251809
Author:
Jay L. Devore
Publisher:
Cengage Learning
Statistics for The Behavioral Sciences (MindTap C…
Statistics
ISBN:
9781305504912
Author:
Frederick J Gravetter, Larry B. Wallnau
Publisher:
Cengage Learning

Elementary Statistics: Picturing the World (7th E…
Statistics
ISBN:
9780134683416
Author:
Ron Larson, Betsy Farber
Publisher:
PEARSON

The Basic Practice of Statistics
Statistics
ISBN:
9781319042578
Author:
David S. Moore, William I. Notz, Michael A. Fligner
Publisher:
W. H. Freeman

Introduction to the Practice of Statistics
Statistics
ISBN:
9781319013387
Author:
David S. Moore, George P. McCabe, Bruce A. Craig
Publisher:
W. H. Freeman