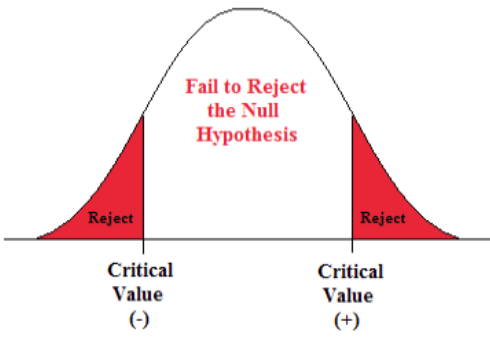
Single Sample Proportion Z-test *This test is appropriate when you have a NOMINAL (dichotomous) variable and the sample size is large (N>100) Making a Decision and Interpreting Results Compare Z (critical) to Z (obtained) Decision: *If Z (obtained) falls into the critical region, REJECT Ho *If Z (obtained) does not fall into the critical region, fail to reject Ho Interpretation: *If you rejected Ho: There is a statistically significant difference *If you failed to reject Ho: There is NOT a statistically significant difference
Correlation
Correlation defines a relationship between two independent variables. It tells the degree to which variables move in relation to each other. When two sets of data are related to each other, there is a correlation between them.
Linear Correlation
A correlation is used to determine the relationships between numerical and categorical variables. In other words, it is an indicator of how things are connected to one another. The correlation analysis is the study of how variables are related.
Regression Analysis
Regression analysis is a statistical method in which it estimates the relationship between a dependent variable and one or more independent variable. In simple terms dependent variable is called as outcome variable and independent variable is called as predictors. Regression analysis is one of the methods to find the trends in data. The independent variable used in Regression analysis is named Predictor variable. It offers data of an associated dependent variable regarding a particular outcome.
Single Sample Proportion Z-test
*This test is appropriate when you have a NOMINAL (dichotomous) variable and the
- Making a Decision and Interpreting Results
Compare Z (critical) to Z (obtained)
Decision:
*If Z (obtained) falls into the critical region, REJECT Ho
*If Z (obtained) does not fall into the critical region, fail to reject Ho
Interpretation:
*If you rejected Ho: There is a statistically significant difference
*If you failed to reject Ho: There is NOT a statistically significant difference
You're on right track, Good :)
Hypothesis testing applications with a dichotomous outcome variable in a single population Z test.
Decision rule says that,
If test statistics > Critical value, we reject the null hypothesis and support alternative.
If test statistics < Critical value, we fail to reject the null hypotheses that are we are in favor of accepting null hypotheses.
Let us create an illustration. ( to draw a curve).
 |
It means that,
If Z (obtained) falls into the critical region, Reject Ho.
If Z (obtained) does not fall into the critical region, fail to reject Ho.
Step by step
Solved in 2 steps with 1 images


