Set up null and alternative hypotheses to try to determine whether there is a difference in ad impact between general TV viewing and VOD viewing. Conduct the hypothesis test defined in (a), using the 0.05 level of significance.
Set up null and alternative hypotheses to try to determine whether there is a difference in ad impact between general TV viewing and VOD viewing. Conduct the hypothesis test defined in (a), using the 0.05 level of significance.

MATLAB: An Introduction with Applications
6th Edition
ISBN:9781119256830
Author:Amos Gilat
Publisher:Amos Gilat
Chapter1: Starting With Matlab
Section: Chapter Questions
Problem 1P

Related questions
Question
a. Set up null and alternative hypotheses to try to determine whether there is a difference in ad impact between general TV viewing and VOD viewing.
Conduct the hypothesis test defined in (a), using the 0.05 level of significance.

Transcribed Image Text:### TV vs. VOD Ad Effectiveness
This study analyzes the effectiveness of advertisements between two audiences: those who watch general TV and those using Video on Demand (VOD) services. The research focuses on whether these ads make viewers more inclined to visit a brand's website.
#### Data Table
| Viewing Audience | Made Me Want to Visit the Brand Website | |
|--------------------|-----------------------------------------|-----------|
| | Yes | No |
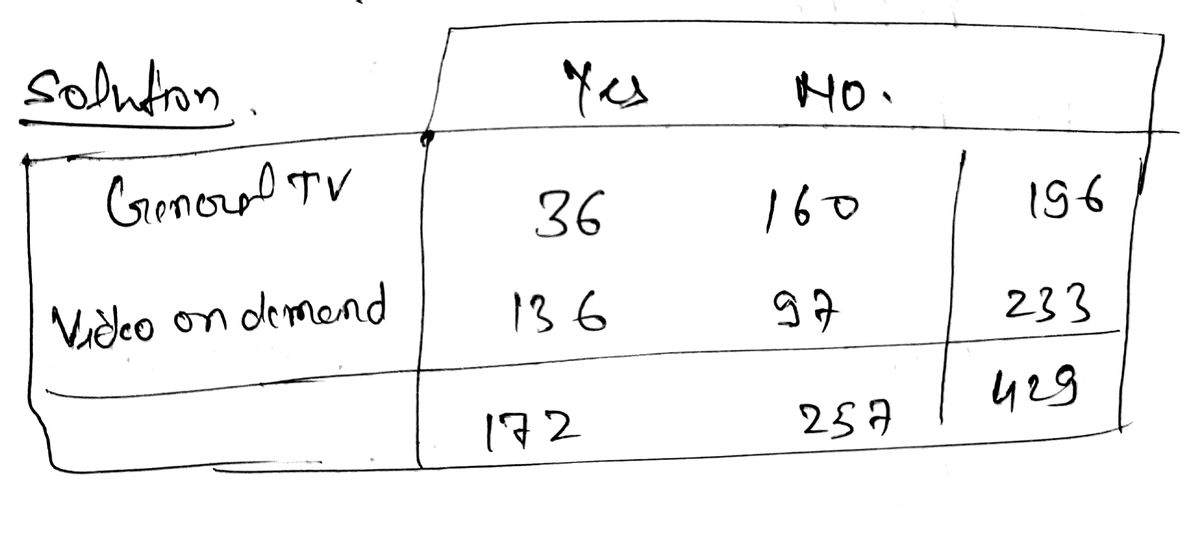
| General TV | 36 | 160 |
| Video on Demand | 136 | 97 |
The table above shows the number of viewers from each audience type who reported being motivated to visit a brand's website after seeing an ad.
#### Hypotheses
The research includes several hypotheses regarding the ad effectiveness:
1. **H0: π1 ≠ π2** - The proportions of motivated viewers are not equal between the two groups.
2. **H1: π1 = π2** - The proportions of motivated viewers are equal between the two groups.
3. **H0: π1 < π2** - The proportion of motivated viewers is less in the first group.
4. **H1: π1 ≥ π2** - The proportion of motivated viewers is equal to or greater in the first group.
5. **H0: π1 ≠ π2** - (Identical to the first hypothesis)
6. **H1: π1 > π2** - The proportion of motivated viewers is greater in the first group.
#### Chi-Square Statistic
A chi-square statistic (χ²) is calculated to test the hypothesis of difference in ad effectiveness. Enter the value rounded to three decimal places as needed.
There are options at the bottom of the page to print the data or indicate completion of the analysis, with buttons for clearing entries and checking the answer.
For further understanding, you can view an example or get more help using the provided options.
Expert Solution
Step 1

Step by step
Solved in 4 steps with 4 images

Recommended textbooks for you
MATLAB: An Introduction with Applications
Statistics
ISBN:
9781119256830
Author:
Amos Gilat
Publisher:
John Wiley & Sons Inc

Probability and Statistics for Engineering and th…
Statistics
ISBN:
9781305251809
Author:
Jay L. Devore
Publisher:
Cengage Learning

Statistics for The Behavioral Sciences (MindTap C…
Statistics
ISBN:
9781305504912
Author:
Frederick J Gravetter, Larry B. Wallnau
Publisher:
Cengage Learning
MATLAB: An Introduction with Applications
Statistics
ISBN:
9781119256830
Author:
Amos Gilat
Publisher:
John Wiley & Sons Inc
Probability and Statistics for Engineering and th…
Statistics
ISBN:
9781305251809
Author:
Jay L. Devore
Publisher:
Cengage Learning
Statistics for The Behavioral Sciences (MindTap C…
Statistics
ISBN:
9781305504912
Author:
Frederick J Gravetter, Larry B. Wallnau
Publisher:
Cengage Learning

Elementary Statistics: Picturing the World (7th E…
Statistics
ISBN:
9780134683416
Author:
Ron Larson, Betsy Farber
Publisher:
PEARSON

The Basic Practice of Statistics
Statistics
ISBN:
9781319042578
Author:
David S. Moore, William I. Notz, Michael A. Fligner
Publisher:
W. H. Freeman

Introduction to the Practice of Statistics
Statistics
ISBN:
9781319013387
Author:
David S. Moore, George P. McCabe, Bruce A. Craig
Publisher:
W. H. Freeman