Recycling in the United States Use the data in the table. Draw at least one scatter plot (for paper, glass, metals, or plastics). Then draw a fitted line. Using your line, estimate the amount the United States will recycle 5 years from now and 10 years from now. U.S. Recycling for Selected Years (1000 tons) Year Paper Plastics Metals Glass 1960 5080 50 100 1965 5336 0. 401 100 1970 6770 0. 480 160 1975 7555 0. 735 368 1980 11,740 20 1220 750 1985 13,316 99 1501 1050 1990 20,230 370 3970 2630 1995 32,700 990 5870 3140 2000 37,560 1480 6600 2880 2005 41,960 1780 6990 2590 2010 44,570 2500 7880 3130 enVision® Florida Algebra 1 Teaching Resources

MATLAB: An Introduction with Applications
6th Edition
ISBN:9781119256830
Author:Amos Gilat
Publisher:Amos Gilat
Chapter1: Starting With Matlab
Section: Chapter Questions
Problem 1P
icon
Related questions
icon
Concept explainers
Topic Video
Question
Linear Functions
BLM 2
Recycling in the United States
Use the data in the table. Draw at least one scatter plot (for paper, glass,
metals, or plastics). Then draw a fitted line. Using your line, estimate the
amount the United States will recycle 5 years from now and 10 years
from now.
U.S. Recycling for Selected Years (1000 tons)
Year
Рaper
Plastics
Metals
Glass
1960
5080
0.
50
100
1965
5336
0.
401
100
1970
6770
480
160
1975
7555
735
368
1980
11,740
20
1220
750
1985
13,316
99
1501
1050
1990
20,230
370
3970
2630
1995
32,700
990
5870
3140
2000
37,560
1480
6600
2880
2005
41,960
1780
6990
2590
2010
44,570
2500
7880
3130
enVision® Florida Algebra 1 • Teaching Resources
Transcribed Image Text:Linear Functions BLM 2 Recycling in the United States Use the data in the table. Draw at least one scatter plot (for paper, glass, metals, or plastics). Then draw a fitted line. Using your line, estimate the amount the United States will recycle 5 years from now and 10 years from now. U.S. Recycling for Selected Years (1000 tons) Year Рaper Plastics Metals Glass 1960 5080 0. 50 100 1965 5336 0. 401 100 1970 6770 480 160 1975 7555 735 368 1980 11,740 20 1220 750 1985 13,316 99 1501 1050 1990 20,230 370 3970 2630 1995 32,700 990 5870 3140 2000 37,560 1480 6600 2880 2005 41,960 1780 6990 2590 2010 44,570 2500 7880 3130 enVision® Florida Algebra 1 • Teaching Resources
Expert Solution
Step 1

The scatter plot for Paper recycling is as follow
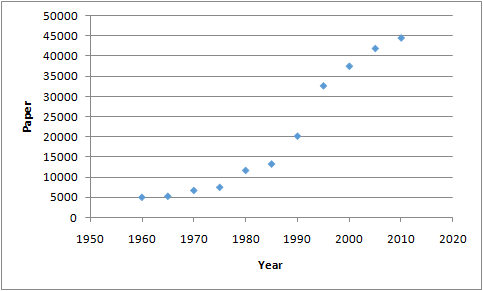
Statistics homework question answer, step 1, image 1

trending now

Trending now

This is a popular solution!

steps

Step by step

Solved in 6 steps with 5 images

Blurred answer
Knowledge Booster
Centre, Spread, and Shape of a Distribution
Learn more about
Need a deep-dive on the concept behind this application? Look no further. Learn more about this topic, statistics and related others by exploring similar questions and additional content below.
Similar questions
Recommended textbooks for you
MATLAB: An Introduction with Applications
Statistics
ISBN:
9781119256830
Author:
Amos Gilat
Publisher:
John Wiley & Sons Inc
Probability and Statistics for Engineering and th…
Statistics
ISBN:
9781305251809
Author:
Jay L. Devore
Publisher:
Cengage Learning
Statistics for The Behavioral Sciences (MindTap C…
Statistics
ISBN:
9781305504912
Author:
Frederick J Gravetter, Larry B. Wallnau
Publisher:
Cengage Learning
Elementary Statistics: Picturing the World (7th E…
Statistics
ISBN:
9780134683416
Author:
Ron Larson, Betsy Farber
Publisher:
PEARSON
The Basic Practice of Statistics
Statistics
ISBN:
9781319042578
Author:
David S. Moore, William I. Notz, Michael A. Fligner
Publisher:
W. H. Freeman
Introduction to the Practice of Statistics
Statistics
ISBN:
9781319013387
Author:
David S. Moore, George P. McCabe, Bruce A. Craig
Publisher:
W. H. Freeman