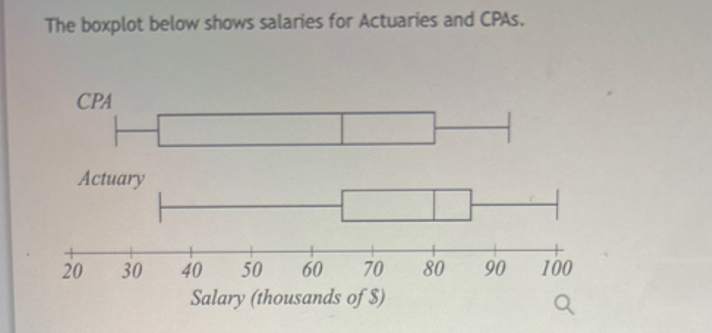
The boxplot below shows salaries for Actuaries and CPAs. CPA Actuary 40 50 60 70 80 90 100 Salary (thousands of $) a Ben makes the median salary for an Actuary. Regina makes the median salary for a CPA. Who makes more money? O Regina Ben 20 30 How much more? $
The boxplot below shows salaries for Actuaries and CPAs. CPA Actuary 40 50 60 70 80 90 100 Salary (thousands of $) a Ben makes the median salary for an Actuary. Regina makes the median salary for a CPA. Who makes more money? O Regina Ben 20 30 How much more? $
MATLAB: An Introduction with Applications
6th Edition
ISBN:9781119256830
Author:Amos Gilat
Publisher:Amos Gilat
Chapter1: Starting With Matlab
Section: Chapter Questions
Problem 1P
Related questions
Question
![**Boxplot of Salaries: Actuaries vs. CPAs**
The boxplot displayed illustrates the salary distributions for Actuaries and CPAs, measured in thousands of dollars.
**CPA:**
- The boxplot begins around $40,000 and extends to $100,000.
- The interquartile range (box) stretches from approximately $60,000 to $90,000.
- The median salary is marked near $75,000.
**Actuary:**
- The boxplot ranges from approximately $30,000 to $90,000.
- The interquartile range (box) is from around $50,000 to $70,000.
- The median salary is indicated at about $60,000.
**Scenario:**
- Ben earns the median salary for an Actuary.
- Regina earns the median salary for a CPA.
**Questions:**
1. Who makes more money?
- Options:
- Regina
- Ben
2. How much more? ($_________)
**[Submit Question Button]**](/v2/_next/image?url=https%3A%2F%2Fcontent.bartleby.com%2Fqna-images%2Fquestion%2F998c0d1a-ff65-42b1-8215-acf4aa1ab8d8%2F2439656f-abe7-48e2-b4a7-36c2ea7bf6d6%2Fbetgbu_processed.jpeg&w=3840&q=75)
Transcribed Image Text:**Boxplot of Salaries: Actuaries vs. CPAs**
The boxplot displayed illustrates the salary distributions for Actuaries and CPAs, measured in thousands of dollars.
**CPA:**
- The boxplot begins around $40,000 and extends to $100,000.
- The interquartile range (box) stretches from approximately $60,000 to $90,000.
- The median salary is marked near $75,000.
**Actuary:**
- The boxplot ranges from approximately $30,000 to $90,000.
- The interquartile range (box) is from around $50,000 to $70,000.
- The median salary is indicated at about $60,000.
**Scenario:**
- Ben earns the median salary for an Actuary.
- Regina earns the median salary for a CPA.
**Questions:**
1. Who makes more money?
- Options:
- Regina
- Ben
2. How much more? ($_________)
**[Submit Question Button]**
Expert Solution
Step 1: Introduction to the given problem
We are given two box plots and asked one question based on them.
Given box plots:

Given that Ben makes the median salary for an Actuary and Regina makes the median salary for a CPA.
Step by step
Solved in 4 steps with 2 images

Recommended textbooks for you

MATLAB: An Introduction with Applications
Statistics
ISBN:
9781119256830
Author:
Amos Gilat
Publisher:
John Wiley & Sons Inc

Probability and Statistics for Engineering and th…
Statistics
ISBN:
9781305251809
Author:
Jay L. Devore
Publisher:
Cengage Learning

Statistics for The Behavioral Sciences (MindTap C…
Statistics
ISBN:
9781305504912
Author:
Frederick J Gravetter, Larry B. Wallnau
Publisher:
Cengage Learning

MATLAB: An Introduction with Applications
Statistics
ISBN:
9781119256830
Author:
Amos Gilat
Publisher:
John Wiley & Sons Inc

Probability and Statistics for Engineering and th…
Statistics
ISBN:
9781305251809
Author:
Jay L. Devore
Publisher:
Cengage Learning

Statistics for The Behavioral Sciences (MindTap C…
Statistics
ISBN:
9781305504912
Author:
Frederick J Gravetter, Larry B. Wallnau
Publisher:
Cengage Learning

Elementary Statistics: Picturing the World (7th E…
Statistics
ISBN:
9780134683416
Author:
Ron Larson, Betsy Farber
Publisher:
PEARSON

The Basic Practice of Statistics
Statistics
ISBN:
9781319042578
Author:
David S. Moore, William I. Notz, Michael A. Fligner
Publisher:
W. H. Freeman

Introduction to the Practice of Statistics
Statistics
ISBN:
9781319013387
Author:
David S. Moore, George P. McCabe, Bruce A. Craig
Publisher:
W. H. Freeman