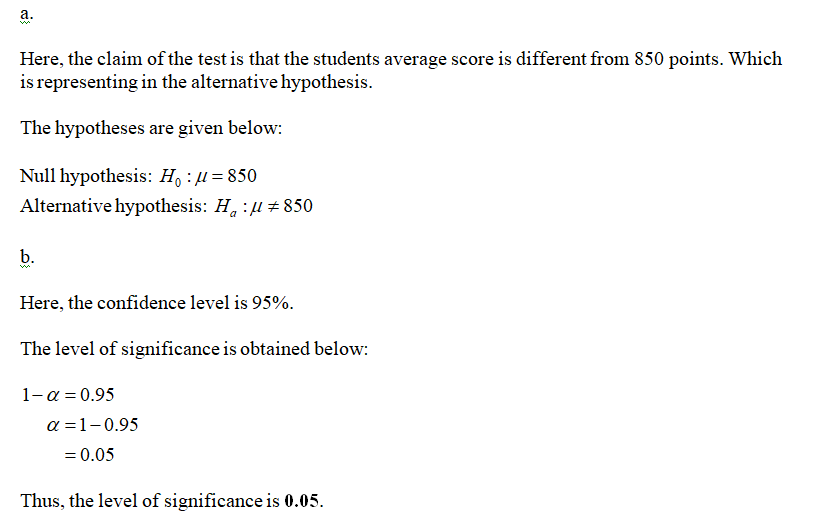
Records show that students score an average of 850 points on an achievement test. A test prep company believe their students will have different scores. To test this hypothesis, they sample 1000 students and find a sample mean of 856 points. They perform the hypothesis test at a confidence level of 95%. a. State the null and alternative hypothesis mathematically b. What is the significance level? c. If 856 is a significantly significant score after being transformed into a z statistic, where will it lie in the distribution below? In area 1, area 2 or area 3?
Records show that students score an average of 850 points on an achievement test. A test prep company believe their students will have different scores. To test this hypothesis, they sample 1000 students and find a sample mean of 856 points. They perform the hypothesis test at a confidence level of 95%. a. State the null and alternative hypothesis mathematically b. What is the significance level? c. If 856 is a significantly significant score after being transformed into a z statistic, where will it lie in the distribution below? In area 1, area 2 or area 3?
MATLAB: An Introduction with Applications
6th Edition
ISBN:9781119256830
Author:Amos Gilat
Publisher:Amos Gilat
Chapter1: Starting With Matlab
Section: Chapter Questions
Problem 1P
Related questions
Question
Records show that students score an average of 850 points on an achievement test. A test
prep company believe their students will have different scores. To test this hypothesis, they
sample 1000 students and find a sample mean of 856 points. They perform the hypothesis test
at a confidence level of 95%.
a. State the null and alternative hypothesis mathematically
b. What is the significance level?
c. If 856 is a significantly significant score after being transformed into a z statistic, where will
it lie in the distribution below? In area 1, area 2 or area 3?
it lie in the distribution below? In area 1, area 2 or area 3?

Transcribed Image Text:The image features a standard normal distribution curve, often referred to as a bell curve, which is symmetrical in shape. This type of curve is used in statistics to represent the distribution of values, scores, or measurements.
### Breakdown of the Curve:
- **Center of the Curve (Area 2):**
- Encompasses 95% of the data within the distribution.
- This central area represents the mean (average) with standard deviations typically ranging from -2 to +2.
- **Tails of the Curve (Area 1 and Area 3):**
- Each tail (Area 1 on the right and Area 3 on the left) represents 2.5% of the distribution.
- This means that each tail contains the extreme values on either side of the mean.
- Often used to identify outliers or rare events in a dataset.
### Usage in Statistics:
The curve is utilized in various statistical analyses, including hypothesis testing and confidence interval estimation. The 95% area indicates a common confidence level used to assess the certainty or reliability of the statistical conclusions.
Expert Solution
Step 1

Step by step
Solved in 2 steps with 2 images

Recommended textbooks for you

MATLAB: An Introduction with Applications
Statistics
ISBN:
9781119256830
Author:
Amos Gilat
Publisher:
John Wiley & Sons Inc

Probability and Statistics for Engineering and th…
Statistics
ISBN:
9781305251809
Author:
Jay L. Devore
Publisher:
Cengage Learning

Statistics for The Behavioral Sciences (MindTap C…
Statistics
ISBN:
9781305504912
Author:
Frederick J Gravetter, Larry B. Wallnau
Publisher:
Cengage Learning

MATLAB: An Introduction with Applications
Statistics
ISBN:
9781119256830
Author:
Amos Gilat
Publisher:
John Wiley & Sons Inc

Probability and Statistics for Engineering and th…
Statistics
ISBN:
9781305251809
Author:
Jay L. Devore
Publisher:
Cengage Learning

Statistics for The Behavioral Sciences (MindTap C…
Statistics
ISBN:
9781305504912
Author:
Frederick J Gravetter, Larry B. Wallnau
Publisher:
Cengage Learning

Elementary Statistics: Picturing the World (7th E…
Statistics
ISBN:
9780134683416
Author:
Ron Larson, Betsy Farber
Publisher:
PEARSON

The Basic Practice of Statistics
Statistics
ISBN:
9781319042578
Author:
David S. Moore, William I. Notz, Michael A. Fligner
Publisher:
W. H. Freeman

Introduction to the Practice of Statistics
Statistics
ISBN:
9781319013387
Author:
David S. Moore, George P. McCabe, Bruce A. Craig
Publisher:
W. H. Freeman