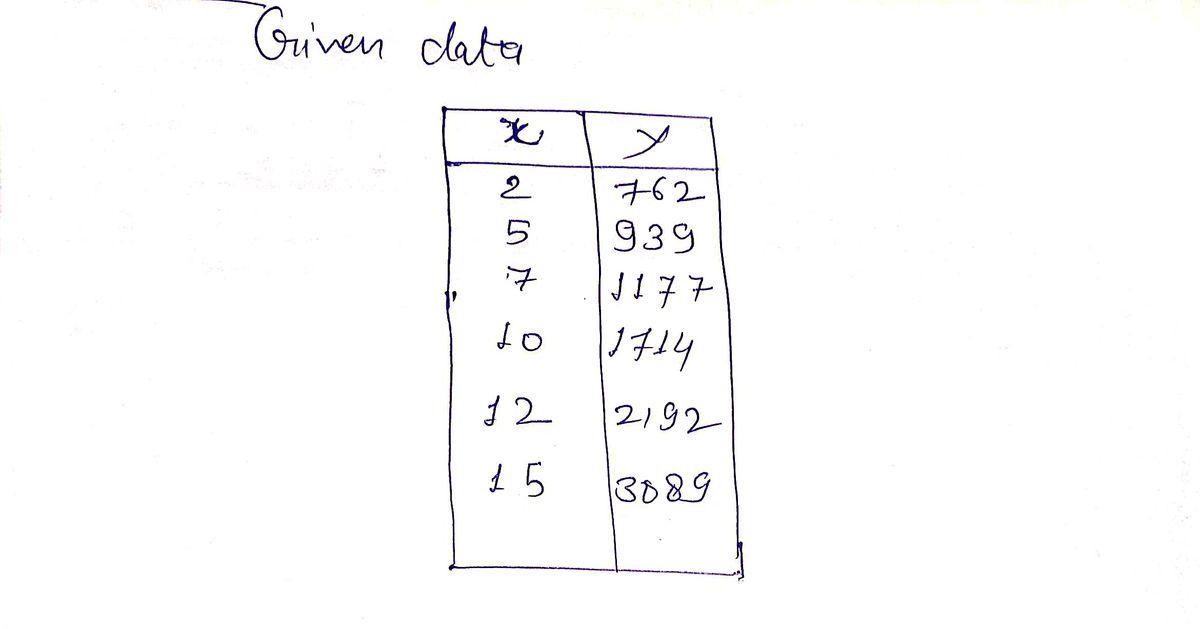
Question Determine the quadratic regression for the data set below. (2, 762), (5, 939), (7, 1177), (10, 1714), (12, 2192), (15, 3089)
Q: Find the 5 number summary for the data shown below. 97 65 62 83 85 7 3 15 94 87 5 number…
A: Writing the numbers is ascending order(from smallest to largest) 3, 7, 15, 62, 65, 83, 85, 87, 94,…
Q: (C) uraw a scatter aiagram, treatıng year as tne expianatory variapie. unoose tne correct grap Full…
A: Use the Excel and draw the Scatterplot Followings are the Steps to draw the Scatterplot 1) Open the…
Q: 5-2*=240 3. 5 3 20 6-102x = 48 4. 4.52x = 300 %3D %3D
A:
Q: The data and scatter plot below compares the number of products a factory produced and the number of…
A:
Q: 4. An orange contains 100 mg of Vitamin C. It is recommended for a person to eat up to 2,000 mg of…
A: Given data : An orange contains 100 mg of Vitamin C. It is recommended for a person to eat up to…
Q: x 1 2 3 4 5 y 14 18.9 14.4 19.6 20 ∑ x = 15 ; ∑ y = 86.9 ; ∑ x 2 = 55 ; ∑ y 2 = 1544.73 ; ∑ x…
A: The provided data is,
Q: (e, i) Find the P-value of your result in (e, i). Use three decimals in your answer. P-value = ()…
A: We have a data with 56 rows and 2 columns. We want to find the regression equation and the…
Q: Draw a scatter diagram and find r for the data shown in the table. (Round r to three decimal…
A: Given data,
Q: (S/bu.) (Billion bu.) (S/bu.) (Billion bu 2.15 6.29 2.07 9.78 2.29 7.27 2.15 9.35 2.36 7.53 2.22…
A: Part (a): Linear regression model for the price- supply data where x is supply and y is price:
Q: The table below contains information on 48 houses: the value of the house and the amount of rental…
A: The independent variable is house value. The dependent variable is Rental Income. This is simple…
Q: The regression line that gives the linear relationship between the magnitude of the earthquake and…
A: Regression equation has two regression coefficients, they are slope and intercept. Slope comes…
Q: (c)Estimate Pearson’s First Coefficient of skewness for the given the Data: 91 62 54 72…
A: Pearson’s First Coefficient of skewness formula SKp = (Mean - Mode) /SD
Q: A auto shop wants to examine the proportion of customers that have to return after an appointment.…
A: Given information- We have given that an Auto shop wants to examine the proportion of customers that…
Q: A warehouse manager collects the following data on order interarrival times (in days) for a certar…
A: Let us denote the interarrival times as X. Given that the interarrival times come from an…
Q: t sales 1 324 23 2 245 256 4 567 5 346 16 357 7 357 68 257 9 1678 What is the regression trend…
A: Sales = 33.77 + (90.73*t) Explanation:I will use Excel for run a regression analysis, here are the…
Q: redictor variable are correct
A: Question: In regression analysis, the variable that is used to explain the change in the outcome of…
Q: A retailer wants to see if a red "Sale" sign brings in the same amount of revenue than the same…
A: A t test of two sample can be used to test whether the mean of two independent populations is equal…
Q: F 6 7 8 10 11 12 13 14 15 16 17 18 data Q Based on the boxplot above, what is the value for the…
A: Given boxplot isWe have to find the value for the minimumWe know thatA box plot is constructed from…
Q: Find the regression model for the data given
A: The objective is to determine the regression model for the given data.
Q: The following data represent the time between eruptions and the length of eruption for 8 randomly…
A: The coefficient of determination is 87.6%.
Q: 0 2 3 4 6 8 1011 12 14 16 18 20 22 16 data points find the fraction between 6 and 11
A: To find the fraction between 6 and 11, you will need to convert these numbers into a common…
Q: Adobe Ac Is there more variation in the output of one shift in a manufacturing plant than in another…
A: Given data:Sample 2 : productivity report from 4pm to…
Q: What is the residual plot for the data in the given table? x 1 2 3 4 5 6…
A: Solution-: We want to the residual plot for the data in the given table? X Y 1 31 2 28 3…
Q: 0.8 3.6 5.2 22 5.4 +1 1.8 4.1 2.6 3.3 %3D 6.3 (b) %3D -2 %3D +. 0. +. 0. Worksheet 1 Worksheet 2 nd…
A: Given two worksheets (a) and (b) To solve: Equation (a) using matrix inverse Equation (b) using…
Q: For the data set with u = 275 and a = 25 What percent of the data is between… 250 and 300 __________…
A: Since you have asked a problem with multiple subparts, we are here to answer only the first three…
Q: The table below shows a partial computer output for a real estate data for 50 residences that we…
A: Test statistics value which is F test is 45.53 And corresponding p value is 0.000 which is very…
Q: which one of the following options will be your best guess for the correlation (r) between calories…
A:
Q: You wonder whether talking to plants keeps them from dying. You conduct a study in which you talk to…
A:
Q: For the data set with u = 50 and a= 5 What percent of the data is between… 45 and 50 __________ 45…
A: Solution-: Given: μ=50,σ=5 We want to find What percent of the data is between 45 and 50? What…
Q: A Bachelors in Finance (Hons) student wishes to see if there is a relationship between the amount of…
A: We have given that, X :- 1924, 907, 1445, 1608, 661 Y:- 1685, 1838, 1734, 1842, 1317 Then, We will…
Q: Person's coefficient of skewness
A: Skewness is used to measure the symmetrical distribution of the data set. It shows two types of…
Q: Below is a data for rainfall and runoff volume in Marfa Texas Rainfall 5 12 14 17 23 30 40 47 Run…
A: Given that Following table shows the calculations: X Y X^2 Y^2 XY 5 4 25 16 20 12 10…
Q: Company Size Social Media Use Small Medium Large Yes 78 42 23 No 26 37 22 What is the calculated…
A: Observed values with marginal totals:
Q: An independent variable that makes a unique contribution to the prediction of a dependent variable…
A: Given that, An independent variable that makes a unique contribution to the prediction of a…
Q: study was done to look at the relationship between number of vacation days employees take each year…
A: Solution: Let x = Vacation days and y = Sick days x y xy x2 y2 2 10 20 4 100 7 3 21 49 9…
Q: What percentage ) What percentage of the people do not smoke? of the people do not exercise…
A: The data is given by Smoke Do not smoke Total Exercise regularly 4 21 25 Do not exercise…
Q: The summer monsoon rains bring 80% of India's rainfall and are essential for the country's…
A: The 68-95-99.7 rule states that in a normal distribution 68%, 95% and 99.7% of the values lie within…
Q: 2. Use technology to determine regression equation between house value and rental income. Enter…
A: The data shows the value of the house and the amount of rental income for 48 houses.
Q: 10 20 30 40 50 60 70 80 Wind speed (km/h The inter quartile range for the wind speeds is
A:
Q: County Hospitalizations Use variable Hospitalizations to perform the calculations. All results…
A: Given data: County Hospitalizations Dougherty 283 Cobb 431 Hall 154 Clayton 113 Unknown…
Q: Use the scatterplot of Vehicle Registrations below to answer the questions Vehicle Registrations in…
A: The scatter plot is given as:
Q: Use the data in the given table to fill in the missing coefficients. Round your answers to 3 decimal…
A: x y 6 31.2 9.5 39.837 13 51.102 16.5 59.55 20 67.62 23.5 77.666 27 86.142
Q: The following data give the percentage of men working in five in the retail and trade industries.…
A:
Q: The volume of oxygen consumed (in liters per minute) while a person is at rest and while a person is…
A: Given a scatter plot and we need to determine explanatory variable.
Q: The personnel director of a large hospital is interested in determining the relationship (if any)…
A: The objective of this question is to find the 95% confidence interval for the average number of sick…
Solution
Step by step
Solved in 3 steps with 3 images
- A survey of 1520 Americans adults asked "Do you feel overloaded with too much information?" The results indicate that 80% of females feel information overload compared to 65% of males. The results are given in table. Overloaded Yes Gender Male Female Total 480 624 1104 a. Construct contingency tables based on total percentages, row percentages, and column percentages. b. What conclusions can you reach from these analyses? No 260 156 416 Total 740 780 1520 ... a. Construct contingency tables based on total percentages, row percentages, and column percentages. Start with the table based on total percentages. Gender Overloaded Male Female Total Yes % % No % % % Total % (Round to two decimal places as needed.) Construct the table based on row percentages. Gender Overloaded Male Female Total % % Yes % No % % Total % % %A. run a simple regression- dependent variable is Weeks, independent variable is Age. B. run a multiple regression with dependent variable weeks and independent variable-age, married, head, manager and sales. C. Create the regular and standardized residual plots for both. Please show the tables when entering values of the regression for both the outputs and the scatter plots.Periodical Spider-Man Fortune Federation MadNumber 156 52 26 78% of Library 18.6% 6.2% 3.1% 7.0%One of the percentages in this table is incorrect. Which is it?a. 18.6% (Spider-Man)b. 6.2% (Soldier of Fortune)c. 3.1% (WWF)d. 7.0% (Mad)
- A study was done to look at the relationship between number of vacation days employees take each year and the number of sick days they take each year. The results of the survey are shown below. Vacation Days 5 15 13 3 9 0 3 7 7 14 4 Sick Days 5 5 1 5 4 9 9 6 5 3 9 Use the model to predict the number of sick days taken for an employee who took 3 vacation days this year.Sick Days = ? (Please round your answer to the nearest whole number.) Interpret the slope of the regression line in the context of the question: As x goes up, y goes down. The slope has no practical meaning since a negative number cannot occur with vacation days and sick days. For every additional vacation day taken, employees tend to take on average 0.40 fewer sick days. Interpret the y-intercept in the context of the question: The y-intercept has no practical meaning for this study. If an employee takes no vacation days, then that employee will take 8 sick days. The average number of sick days is…The table shows the national expenditures for health care in billions, in a country for the selected years from 1990 to 2020. Given the projection cost for the year 2002, identify the type of regression point. Year Exprenditures ($billions) 1991 1020 1994 1356 1998 1984 2004 2984 2009 3374 2016 4765 2020 5937 Interpolation Extrapolation Neither Bothusing the excel data ... College Student Weekly Earnings in Dollars (n = 5) Hours Worked (X) Weekly Pay (Y) (xi - x̅)2 (yi - y̅)2 (xi - x̅)(yi - y̅) 11 95 16 173 22 210 18 157 30 270 x̅=?????? y̅=??????? SSxx SSyy SSxy
- Ozone levels (in parts per billion, ppb) were recorded at sites in New Jersey monthly between 1926 and 1971. Here are boxplots of the data for each month The month of Ozone (ppb) 440- 400- The month of 360- 320- 280- 240 1 L TH OHH OHH a) In what month was the highest ozone level ever recorded? The highest ozone level ever was recorded in b) Which month has the largest IQR? c) Which month has the smallest range? • HIH • has the largest IQR. HOH O HH 2 3 4 5 6 7 8 9 Month has the smallest range. d) Write a brief comparison of the ozone levels in January and June. Choose the correct answer below. OA. The median ozone level in June was slightly lower than the median ozone level in January and the IQR was significantly smaller. OB. The median ozone level in June was slightly higher than the median ozone level in January, but the IQR was significantly smaller. OHH OC. The median ozone level in June was slightly lower than the median ozone level in January, but the IQR was significantly…50Score GPA Hours Absences Gender78 3.15 3.0 4 Female75 2.71 4.0 1 Female79 3.57 3.5 2 Male85 3.26 6.5 0 Female85 3.75 2.0 0 Female84 3.20 4.5 3 Female85 3.16 5.0 3 Male80 3.35 1.5 0 Female74 2.75 3.5 6 Male81 3.04 6.5 1 Male76 2.53 3.0 0 Female85 2.92 6.0 1 Male