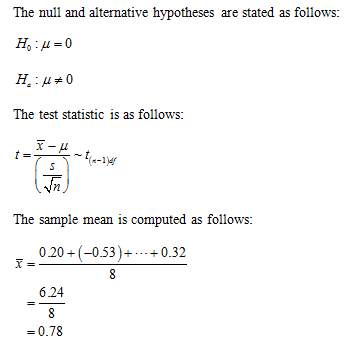
Question 7 out of 9. Using these data below, what is the t statistic for a single-sample t test (null hypothesis is that μ = 0)? Y 0.20 -0.53 1.03 0.44 0.48 2.43 1.87 0.32
Q: You may need to use the appropriate technology to answer this question. Consider the following…
A: As per our guidelines we can solve first three sub part of question and rest can be reposted.…
Q: You may need to use the appropriate technology to answer this question. Consider the following…
A: The question is about hypo. testing Given : Null and alt. hypo. : H0 : μd ≤ 0Ha : μd > 0 Data :…
Q: Previous Problem Problem List Next Problem (1 point) Test the claim that the population of sophomore…
A: Given : Claim : The mean grade point average is greater than 2.3.
Q: Which combination of factors is most likely to produce a significant value for an…
A: The t-test assesses whether the means of two groups are statistically different from each other. The…
Q: 2 this question has part a and b
A: Confidence interval is the range of values and it contains the true population parameter with…
Q: Exhibit 13-12 SSTR = 736 SSE = 900 nT= 18 Refer to Exhibit 13-12. The null hypothesis is to be…
A: Given that There are 3 treatments dfTreatments = 3 - 1 = 2 nT = 18 dfT = 18 - 1 = 17 dfError =…
Q: The following observations were obtained when conducting a two-way ANOVA experiment with no…
A: The -way ANOVA experiment wirh no interaction:Normality is assumed in the populations.
Q: 1: Two random samples taken from two normal populations yielded the following information: Sample 1…
A: Given information- We have given two random samples which are taken from two normal populations. The…
Q: Consider the following hypothesis test Ho: μ1=μ2 Ha: μ1#μ2 The following results are for two…
A: As per our guidelines we can solve first three sub part of question and rest can be reposted.…
Q: μ A study was done using a treatment group and a placebo group. The results are shown in the table.…
A:
Q: Treatment Placebo A study was done using a treatment group and a placebo group. The results are…
A:
Q: Given a critical t score of -2.33 and t observed being -2.01, the decision you should make is…
A: It is given that the critical t score is -2.33 and the observed t value is -2.01.
Q: test the following claim
A: Here population standard deviation unknown so use t test
Q: Test the claim about the population mean μ at the level of significance a. Assume the population is…
A:
Q: The null and alternative hypothesis would be: Ho:µ = 3.4 Ho: µ = 3.4 Ho:p = 0.85 Ho:p= 0.85 Ho:p=…
A: We want to test the claim, that the mean GPA of night student is significantly different than 3.4…
Q: 20) You wish to test the following claim (HaHa) at a significance level of α=0.002α=0.002.…
A: Given that,population mean(u)=61.9sample data: (44.6 , 45.7 , 42 , 50.7 , 54.9 )sample mean, x…
Q: Red Orange 39 43 Yellow Green Blue 43 39 38 39 33 35 31 34 41 44 42 34 32 42 35 39 37 32 45 40 39 36…
A: Hi! Thank you for the question, As per the honor code, we are allowed to answer three sub-parts at a…
Q: Consider the following results for independent random samples taken from two populations. Sample 1…
A:
Q: Hypothesis testing on samples with fewer than 30 participants can be carried out by using the…
A: We know that if a sample size greater than or equal to 30 to be large for which we use the z test.…
Q: Sample size, n Mean Variance (mm) (mm2) Corn diet (group 1) 2.05 0.00558 21 Cotton diet (group 2)…
A: a) Here we will use T-test for two independent samples, since the population standard deviation is…
Q: 2.058
A: For Porsche Driver: sample size (n1) = 16 sample mean (x̄1) = 50 sample variance (s1)2 =9 For…
Q: The following independent samples from two normally distributed populations were observed. You may…
A: Given data :
Q: A sample of n=24 is selected from a population = 120 and σ = 40. If the sample mean is 130, what is…
A: It is given that the population mean, μ=120 and standard deviation, σ=40. For the sample size of 24,…
Q: Test the claim that the mean GPA of night students is larger than 2 at the 0.01 significance level.…
A: Given information Hypothesized mean µ = 2 Sample size (n) = 70 Mean x̅ = 2.03 Standard deviation (s)…
Q: Question 2: Test the claim that the mean GPA of night students is larger than 3.5 at the .01…
A: Given data; Population mean = 3.5 Sample size = 65 Sample mean = 3.51 Significance level = 0.01
Q: ssume that both populations are normally distributed. ) Test whether u, # µ2 at the a = 0.01 level…
A:
Q: Listed below are the lead concentrations in μg/g measured in different traditional medicines. Use a…
A: From the provided information, Sample size (n) = 10 The hypotheses are as follow: H0: µ = 16 µg/g…
Q: For the following experiment, state the type of test we should use. Assume homogeneity of variance…
A: Given: An elementary school teacher notes if each student in his school speaks out or not. And he…
Q: Three (3) treatments were compared using a completely randomized design. The data are shown below.…
A:
Q: You may need to use the appropriate technology to answer this question. The following data are from…
A: “Since you have posted a question with multiple sub-parts, we will solve first three sub-parts for…
Q: 18.14 From the two-sample t test we conclude that (a) individuals with HSAM have significantly…
A:
Q: You wish to test the following claim (HaHa) at a significance level of α=0.02α=0.02.…
A: Given data provides two independent samples , each with 40 observations . The calculated sample…
Q: a. Calculate the pooled estimate of o?.
A: a. The mean for sample 1 is, x¯1=∑Xn1=1.2+3.1+1.7+2.8+3.05=11.85=2.36 The variance for sample 1 is,…
Q: QUESTION 47 A independent sample t-test with a df = 27 resulted in an observed t = 4.27. What would…
A: Here, Given values are, df=27 t=4.27
Q: Question 2 The Excel output below summarises the purchase amounts, in dollars, for a random sample…
A: As per our company guidelines, we are supposed to answer only first 3 sub-parts. Kindly repost other…
Q: Compute the values below (to 1 decimal, if necessary). Sum of Squares, Treatment Sum of Squares,…
A: R code used: library(readxl)df <- read_excel("C:/Users/ragha/Desktop/df.xlsx") aov =…
Q: A soda company distributes diet cola in bottles label 32 oz. The Department of Trade and Industry…
A: Hello! As you have posted 2 different questions, we are answering the first question. In case you…
Q: An airline company is interested in improving customer satisfaction rate from the 75% currently…
A:
Q: You may need to use the appropriate technology to answer this question. Consider the following…
A:
Q: Experience has shown that the weight of apples produced by an orchard is normally distributed, with…
A:
Q: X y 16.9 95.3 67.6 46.6 54.9 67.1 76.4 50.7 40.9 74.8 33.7 68.6 What is the critival value for this…
A: By using above information What is the critival value for this hypothesis test? rc.v.=0.917…
Q: The pulse rates of 215 randomly selected adult males vary from a low of 33 bpm to a high of 121 bpm.…
A: Solution: From the given formation, smallest pulse rate is 33 bpm, the largest pulse rate is 121 bpm…
Q: Suppose we have the following information about two samples: Sample 1 Sample 2 n1=35 n2=45…
A: Given, Sample 1 Sample 2 n1=35 n2=45 x1=82 x2=79 s1=15 s2=18
Q: Source of Variation Treatments Select one: O a rejected at 1% Error 60 Total 135 According to the…
A: Analysis of variance
Q: Three (3) treatments were compared using a completely randomized design. The data are shown below.…
A:
Q: Education Not a H.S. graduate H.S. graduate Some college Bachelor Degree or higher he level of…
A: The following data represents the level of health and level of education. The sample size is 1737…
Q: . What is the null hypothesis for this study? 2. what is the type 1 error associated with this…
A: From the given data we are asked to identify the null hypothesis, Type 1 and Type 2 error.
Question 7 out of 9.
Using these data below, what is the t statistic for a single-sample t test (null hypothesis is that μ = 0)?
Y
0.20
-0.53
1.03
0.44
0.48
2.43
1.87
0.32
Step by step
Solved in 2 steps with 2 images
- Please show work!! Answer this question correctly. Thanks.12Solve the given problem using the stepwise method for testing hypotheses (correlated samples). Use t-test for correlated sample to test if there is no difference between oral contraceptive use and blood pressure (before and after). Use .01 alpha level of significance ( two-tailed). BP Before OC BP After OC 115 128 112 115 107 106 119 128 115 122 138 145 126 132 105 109 104 102 115 117
- You wish to test the following claim (HaHa) at a significance level of α=0.01α=0.01. Ho:μ1=μ2Ho:μ1=μ2 Ha:μ1≠μ2Ha:μ1≠μ2You obtain the following two samples of data. Sample #1 Sample #2 65.8 77.7 105.1 78.6 89.2 69.1 96.7 91.3 105.9 87.5 70.5 93.9 83.4 88.3 79.5 66.7 83.4 91.7 106.7 73 75.7 98.7 76.7 80 53.2 92.1 93 78.2 72.4 79.1 82.1 74.1 78.2 85.5 85.9 99.3 84.2 104.3 88.3 107.6 63.8 99.8 97.7 86.3 74.9 72.7 77.5 93.9 76.1 77.1 81.9 74.1 73.6 78.7 81.9 78.9 81.1 88 85.8 75.3 74.3 77.5 69.1 75.5 72.9 80.1 84.3 73.1 67.3 72.2 76.1 67.8 74.9 67.3 74.7 70.1 65.4 76.9 83.8 79.7 72.9 81.7 74.1 68.2 65.4 80.9 69.4 79.5 96 77.5 77.1 75.9 68.7 What is the test statistic for this sample? (Report answer accurate to three decimal places.)test statistic = What is the p-value for this sample? For this calculation, use the degrees of freedom reported from the technology you are using. (Report answer accurate to four…Which of the following is a Null hypothesis for a paired-samples t-test? μd = 0 μd = X μ1 ≠ μ2 μ1 = μ2The following data were collected from a repeated-measures study. Perform an ANOVA. Use a .05 alpha level. Treatment A B _____________ G = 36 2 6 2 6 ΣX2 = 192 4 4 4 8 ______________ T = 12 T = 24 SS = 4 SS = 8 1) State the null hypothesis. 2) Calculate necessary statistics (USE AN ANOVA even though K=2, and a = .05). 3) Make a decision about your null hypothesis and explain what that decision means. 4) Make a conclusion about your IV and DV that includes an APA format summary of your statistical analysis
- You may need to use the appropriate technology to answer this question. Consider the following hypothesis test. H0: ?d ≤ 0 Ha: ?d > 0 (a) The following data are from matched samples taken from two populations. Compute the difference value for each element. (Use Population 1 − Population 2.) Element Population Difference 1 2 1 21 19 2 28 28 3 18 17 4 20 18 5 26 26 (b) Compute d. (c) Compute the standard deviation sd. (d) Conduct a hypothesis test using ? = 0.05. Calculate the test statistic. (Round your answer to three decimal places.) Calculate the p-value. (Round your answer to four decimal places.) p-value = What is your conclusion? Reject H0. There is insufficient evidence to conclude that ?d > 0. Reject H0. There is sufficient evidence to conclude that ?d > 0. Do not Reject H0. There is sufficient evidence to conclude that ?d > 0. Do not reject H0. There is insufficient evidence to conclude that ?d >…Sun Oct 22 webassign.net You may need to use the appropriate technology to answer this question. The following data are from a completely randomized design. In the following calculations, use a = 0.05. xj Treatment Treatment 1 2 63 46 53 46 52 64.67 о но H1 #Hz #Из H₂H₁ = H₂ = 3 83 = 71 87 71 78 68.00 Treatment 3 70 54 61 51 59 (a) Use analysis of variance to test for a significant difference among the means of the three treatments. State the null and alternative hypotheses. H₁ H₁ = H₂ = 13 H: Not all the population means are equal. 71.33 O Ho: Not all the population means are equal. на: H1 = H2 = Из O Ho: At least two of the population means are equal. H: At least two of the population means are different. Ho: H₁ H₂ H3 на: М1 #M2 #Из Find the value of the test statistic. (Round your answer to two decimal places.) Find the p-value. (Round your answer to three decimal places.) p-value = State your conclusion. O Reject Ho. There is not sufficient evidence to conclude that the means of…Refer to the below table. Using an alpha = 0.05, test the claim that IQ scores are the same for children in three different blood lead level groups: low lead level, medium lead level, and high lead level). One-Way Analysis of Variance Summary Table for IQ Measurements for Children among Three Blood Lead Level Groups: Low Lead Level, Medium Lead Level, and High Lead Level. Source df SS MS F p Between-group (treatment) 2 469.1827 2677.864 2.30 0.104 Within-group (error) 118 203.6918 11745.05 Total 120
- Question 5 The following questions are based on hypothesis testing. (a) iid Let, (8.49, 10.39, 9.76, 12.66, 10.35, 10.96, 8.25, 12.14, 7.52, 8.92) Ν (μ, σ) For the same dataset assume that the value of o? is also unknown. Again, at a = 0.01 or 1% significance level, test Họ : µ = 9 against H1 : µ # 9. Again calculate the test statistic, p-value and then comment on the null hypothesis.What type of test it is?