Please explain how to find the mean for a frequency with and without statcrunch and excel. It is not allowing me to upload or copy and paste my question and it is quite lenghty


Inverse Normal Distribution
The method used for finding the corresponding z-critical value in a normal distribution using the known probability is said to be an inverse normal distribution. The inverse normal distribution is a continuous probability distribution with a family of two parameters.
Mean, Median, Mode
It is a descriptive summary of a data set. It can be defined by using some of the measures. The central tendencies do not provide information regarding individual data from the dataset. However, they give a summary of the data set. The central tendency or measure of central tendency is a central or typical value for a probability distribution.
Z-Scores
A z-score is a unit of measurement used in statistics to describe the position of a raw score in terms of its distance from the mean, measured with reference to standard deviation from the mean. Z-scores are useful in statistics because they allow comparison between two scores that belong to different normal distributions.
Please explain how to find the mean for a frequency with and without statcrunch and excel. It is not allowing me to upload or copy and paste my question and it is quite lenghty
Solution: First let\'s learn how to do it manually.
Suppose we have following data given:
4,5,8,2,6,7,9,12,14,6
To find the mean, we have to use the below formula:
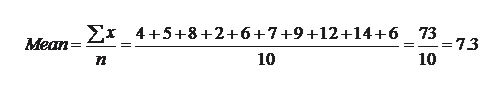
Using StatCrunch: Suppose we have to find the mean of below data set:
4,5,8,2,6,7,9,12,14,6
The first step is to type the above data in column var1.
Then goto Stat > Summary Stats > Columns and left click on Columns. A dialog box will open and then under Select columns, left click on var1. Then Press compute.
The output will display various statistics but you just need to focus on Mean and here in our case Mean will be 7.3

Step by step
Solved in 3 steps with 1 images


