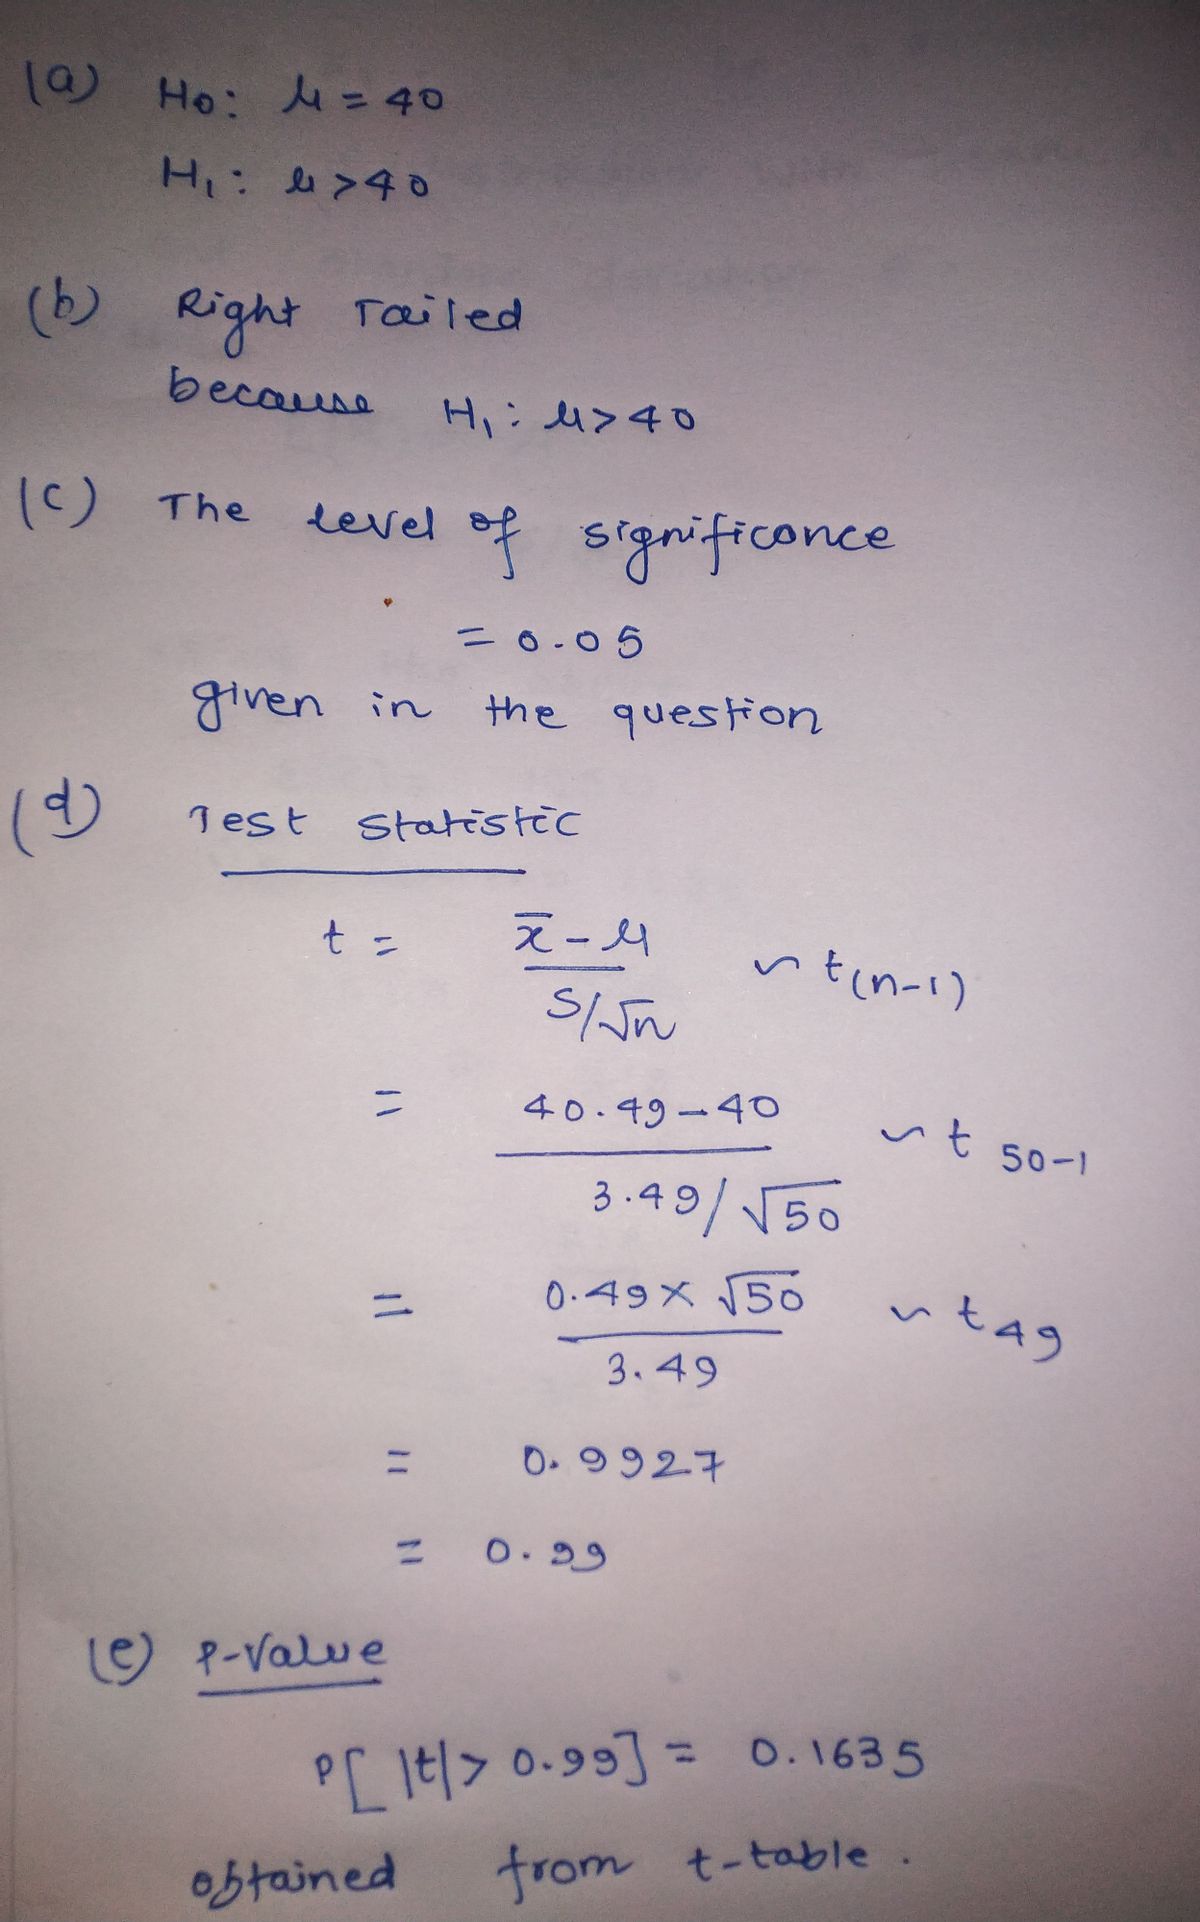
The blue catfish (Ictalurus Furcatus) is the largest species of North American catfish. The current world record stands at 143 pounds, which was caught in the John H. Kerr Reservoir (Bugg's Island Lake) located in Virginia. According to American Expedition, the average weight of a blue catfish is between 20 to 40 pounds. Given that the largest blue catfish ever caught was at the John H. Kerr Reservoir, you believe that the mean weight of the fish in this reservoir is greater than 40 pounds. Use the data below, which represents the summary statistics for 50 blue catfish caught at this reservoir, and a 0.05 significance level to test the claim that the mean weight of the fish in the John H. Kerr Reservoir is greater than 40 pounds. n=50 ; ¯x=40.49 pounds; s=3.49 pounds a) Identify the null and alternative hypotheses? H0: H1: b) What type of hypothesis test should you conduct (left-, right-, or two-tailed)? left-tailed right-tailed two-tailed c) Identify the appropriate significance level as a decimal. d) Calculate your test statistic. Write the result below, and be sure to round your final answer to two decimal places. e) Calculate your p-value. Write the result below, and be sure to round your final answer to four decimal places. f) Do you reject the null hypothesis? We reject the null hypothesis, since the p-value is less than the significance level. We reject the null hypothesis, since the p-value is not less than the significance level. We fail to reject the null hypothesis, since the p-value is less than the significance level. We fail to reject the null hypothesis, since the p-value is not less than the significance level. g) Select the statement below that best represents the conclusion that can be made. There is sufficient evidence to warrant rejection of the claim that the mean weight of the fish in the John H. Kerr Reservoir is greater than 40 pounds. There is not sufficient evidence to warrant rejection of the claim that the mean weight of the fish in the John H. Kerr Reservoir is greater than 40 pounds. There is sufficient evidence to support the claim that the mean weight of the fish in the John H. Kerr Reservoir is greater than 40 pounds. There is not sufficient evidence to support the claim that the mean weight of the fish in the John H. Kerr Reservoir


Continuous Probability Distributions
Probability distributions are of two types, which are continuous probability distributions and discrete probability distributions. A continuous probability distribution contains an infinite number of values. For example, if time is infinite: you could count from 0 to a trillion seconds, billion seconds, so on indefinitely. A discrete probability distribution consists of only a countable set of possible values.
Normal Distribution
Suppose we had to design a bathroom weighing scale, how would we decide what should be the range of the weighing machine? Would we take the highest recorded human weight in history and use that as the upper limit for our weighing scale? This may not be a great idea as the sensitivity of the scale would get reduced if the range is too large. At the same time, if we keep the upper limit too low, it may not be usable for a large percentage of the population!
The blue catfish (Ictalurus Furcatus) is the largest species of North American catfish. The current world record stands at 143 pounds, which was caught in the John H. Kerr Reservoir (Bugg's Island Lake) located in Virginia. According to American Expedition, the average weight of a blue catfish is between 20 to 40 pounds. Given that the largest blue catfish ever caught was at the John H. Kerr Reservoir, you believe that the
n=50
; ¯x=40.49 pounds; s=3.49
pounds
a) Identify the null and alternative hypotheses?
H0:
H1:
b) What type of hypothesis test should you conduct (left-, right-, or two-tailed)?
- left-tailed
- right-tailed
- two-tailed
c) Identify the appropriate significance level as a decimal.
d) Calculate your test statistic. Write the result below, and be sure to round your final answer to two decimal places.
e) Calculate your p-value. Write the result below, and be sure to round your final answer to four decimal places.
f) Do you reject the null hypothesis?
- We reject the null hypothesis, since the p-value is less than the significance level.
- We reject the null hypothesis, since the p-value is not less than the significance level.
- We fail to reject the null hypothesis, since the p-value is less than the significance level.
- We fail to reject the null hypothesis, since the p-value is not less than the significance level.
g) Select the statement below that best represents the conclusion that can be made.
- There is sufficient evidence to warrant rejection of the claim that the mean weight of the fish in the John H. Kerr Reservoir is greater than 40 pounds.
- There is not sufficient evidence to warrant rejection of the claim that the mean weight of the fish in the John H. Kerr Reservoir is greater than 40 pounds.
- There is sufficient evidence to support the claim that the mean weight of the fish in the John H. Kerr Reservoir is greater than 40 pounds.
- There is not sufficient evidence to support the claim that the mean weight of the fish in the John H. Kerr Reservoir is greater than 40 pounds.


Trending now
This is a popular solution!

Step by step
Solved in 2 steps with 1 images


