Overview: There are numerous courses at the collegiate level that students are able to take either face to face or online. Some students prefer the flexibility and structure of the online format, while other students prefer face to face. A statistics professor at a local community college was interested in determining whether students performed better in a traditional face to face classroom or in an online format. During a semester where she was teaching statistics both face to face and online, she decided to provide all of her students with the exact same resources (reviews, assignments, etc.) and the exact same final exam. She wanted to compare the final exam scores to try and determine if students learn better through a specific modality. She collected the final exam scores from all of her students in each class; however, for our purposes we will focus on a random sample of 12 students from her online class and 12 students from her face to face class. Their final exam scores are shown below.
Overview: There are numerous courses at the collegiate level that students are able to take either face to face or online. Some students prefer the flexibility and structure of the online format, while other students prefer face to face. A statistics professor at a local community college was interested in determining whether students performed better in a traditional face to face classroom or in an online format. During a semester where she was teaching statistics both face to face and online, she decided to provide all of her students with the exact same resources (reviews, assignments, etc.) and the exact same final exam. She wanted to compare the final exam scores to try and determine if students learn better through a specific modality. She collected the final exam scores from all of her students in each class; however, for our purposes we will focus on a random sample of 12 students from her online class and 12 students from her face to face class. Their final exam scores are shown below.

MATLAB: An Introduction with Applications
6th Edition
ISBN:9781119256830
Author:Amos Gilat
Publisher:Amos Gilat
Chapter1: Starting With Matlab
Section: Chapter Questions
Problem 1P

Related questions

Topic Video
Question

Transcribed Image Text:Overview: There are numerous courses at the collegiate level that students are able to take
either face to face or online. Some students prefer the flexibility and structure of the online
format, while other students prefer face to face. A statistics professor at a local community
college was interested in determining whether students performed better in a traditional face to
face classroom or in an online format. During a semester where she was teaching statistics both
face to face and online, she decided to provide all of her students with the exact same resources
(reviews, assignments, etc.) and the exact same final exam. She wanted to compare the final
exam scores to try and determine if students learn better through a specific modality. She
collected the final exam scores from all of her students in each class; however, for our purposes
we will focus on a random sample of 12 students from her online class and 12 students from her
face to face class. Their final exam scores are shown below.
Expert Solution
Step 1
Null Hypothesis:
H0: There is no sufficient evidence that the standard deviation of face to face exam scores is larger than the standard deviation of Online.
Alternative Hypothesis:
H1:There is a sufficient evidence that the standard deviation of face to face exam scores is larger than the standard deviation of Online.
Excel Procedure:
- Enter the data for face to face and online in Excel sheet.
- Go to Data
- Click on Data Analysis.
- Select ‘F test Two-sample for Variances’ and click on ‘OK’
- Select the column of ‘face to face’ under ‘Variable 1 Range’.
- Select the column of ‘online’ under ‘Variable 2 Range’.
- Enter 0 under ‘Hypothesized Mean Difference’.
- Click on ‘OK’.
Excel Output:
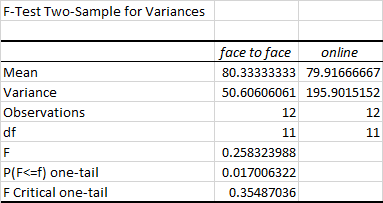
From the output, the p value for one tail test is 0.017.
The two tail p value is 2*0.017=0.034.

Step by step
Solved in 2 steps with 1 images

Knowledge Booster


Learn more about
Need a deep-dive on the concept behind this application? Look no further. Learn more about this topic, statistics and related others by exploring similar questions and additional content below.Recommended textbooks for you
MATLAB: An Introduction with Applications
Statistics
ISBN:
9781119256830
Author:
Amos Gilat
Publisher:
John Wiley & Sons Inc

Probability and Statistics for Engineering and th…
Statistics
ISBN:
9781305251809
Author:
Jay L. Devore
Publisher:
Cengage Learning

Statistics for The Behavioral Sciences (MindTap C…
Statistics
ISBN:
9781305504912
Author:
Frederick J Gravetter, Larry B. Wallnau
Publisher:
Cengage Learning
MATLAB: An Introduction with Applications
Statistics
ISBN:
9781119256830
Author:
Amos Gilat
Publisher:
John Wiley & Sons Inc
Probability and Statistics for Engineering and th…
Statistics
ISBN:
9781305251809
Author:
Jay L. Devore
Publisher:
Cengage Learning
Statistics for The Behavioral Sciences (MindTap C…
Statistics
ISBN:
9781305504912
Author:
Frederick J Gravetter, Larry B. Wallnau
Publisher:
Cengage Learning

Elementary Statistics: Picturing the World (7th E…
Statistics
ISBN:
9780134683416
Author:
Ron Larson, Betsy Farber
Publisher:
PEARSON

The Basic Practice of Statistics
Statistics
ISBN:
9781319042578
Author:
David S. Moore, William I. Notz, Michael A. Fligner
Publisher:
W. H. Freeman

Introduction to the Practice of Statistics
Statistics
ISBN:
9781319013387
Author:
David S. Moore, George P. McCabe, Bruce A. Craig
Publisher:
W. H. Freeman