Total revenue for a soda in January 2011 was $4,342,262, and total revenue in January 2013 was $4,429,964. See the data below. The soda company is requesting your help as manager to understand how price increases are affecting the quantity of sodas sold. Create a table with the descriptive statistics of the number of sodas sold in the two years, as well as an explanation of the descriptive statistics: What are some of the key aspects of the descriptive statistics that help you tell a story about the 2 years in sodas sold. Run a regression where you explain how price changes are affecting the quantity of sodas sold. Include an explanation of the coefficients as well as an explanation of the t-statistics, the intercept, the R-Squared, and the F-Statistic. Explain managerial recommendations to the soda company on how can you increase the revenue.
Total revenue for a soda in January 2011 was $4,342,262, and total revenue in January 2013 was $4,429,964. See the data below. The soda company is requesting your help as manager to understand how price increases are affecting the quantity of sodas sold. Create a table with the descriptive statistics of the number of sodas sold in the two years, as well as an explanation of the descriptive statistics: What are some of the key aspects of the descriptive statistics that help you tell a story about the 2 years in sodas sold. Run a regression where you explain how price changes are affecting the quantity of sodas sold. Include an explanation of the coefficients as well as an explanation of the t-statistics, the intercept, the R-Squared, and the F-Statistic. Explain managerial recommendations to the soda company on how can you increase the revenue.

A First Course in Probability (10th Edition)
10th Edition
ISBN:9780134753119
Author:Sheldon Ross
Publisher:Sheldon Ross
Chapter1: Combinatorial Analysis
Section: Chapter Questions
Problem 1.1P: a. How many different 7-place license plates are possible if the first 2 places are for letters and...

Related questions
Question
100%
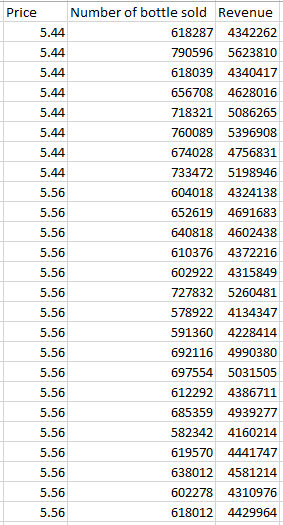
Total revenue for a soda in January 2011 was $4,342,262, and total revenue in January 2013 was $4,429,964. See the data below. The soda company is requesting your help as manager to understand how price increases are affecting the quantity of sodas sold.
- Create a table with the
descriptive statistics of the number of sodas sold in the two years, as well as an explanation of the descriptive statistics: What are some of the key aspects of the descriptive statistics that help you tell a story about the 2 years in sodas sold. - Run a regression where you explain how price changes are affecting the quantity of sodas sold. Include an explanation of the coefficients as well as an explanation of the t-statistics, the intercept, the R-Squared, and the F-Statistic.
- Explain managerial recommendations to the soda company on how can you increase the revenue.

Transcribed Image Text:Jan-11
$5.44 618,287 $4,342,262
Feb-11
$5.44 790,596 $5,623,810
Mar-11
$544 618,039 $4,340,417
Apr-11
May-11
$5.44 656,78 $4,628,016
$544 718,321 $5,086,265
Jun-11
$5.44 760,089 $5,396,903
Jul-11
$544 674,028 $4,756,831
$544 733,472 $5,198,946
Aug-11
Sep-11
$5.56 G04,018 $4,324,138
Oct-11
$5.56 652,619 $4,691,683
Nov-11
$5.56 640,818 $4,602,438
Dec-11
$5.56 610,376 $4,372,216
Jan-12
$5.56 602,922 $4,315,849
Feb-12
$5.56 727,832 $5,260,481
Mar-12
$5.56 578,922 $4,134,347
Apr-12
May-12
Jun-12
Jul-12
$5.56 591,360 $4,228,414
$5.56 692,116 $4,990,380
$5.56 697,554 $5,031,505
$5.56 612,292 $4,386,711
Aug-12
Sep-12
$5.56 685,359 $4,939,277
$5.56 582,342 $4,160,214
Oct-12
$5.56 619,570 $4,441,747
Nov-12
$5.56 638,012 $4,581,214
Dec-12
$5.56 602,278 $4,310,976
Jan-13
$5.56 618,012 $4,429,964
Expert Solution
Step 1
Given :

Step by step
Solved in 5 steps with 3 images

Recommended textbooks for you
A First Course in Probability (10th Edition)
Probability
ISBN:
9780134753119
Author:
Sheldon Ross
Publisher:
PEARSON

A First Course in Probability (10th Edition)
Probability
ISBN:
9780134753119
Author:
Sheldon Ross
Publisher:
PEARSON