outer output was used as a part of the model adequacy chi rocedure Test Tests for Normality Statistic Shapiro-Wilk W ess ALT+F10 (PC) or ALT+FN+F10 (Mac). Paragraph 0.985 Pr < W p Value Arial 0.075 10pt HA 8
Q: If you use a 0.05 level of significance in a two-tail hypothesis test, what decision will you make…
A:
Q: In a cognitive psychology experiment, the researcher is interested in whether encoding condition has…
A: The provided information is as follows:The sample size is .The level of significance is .The test is…
Q: A research study wanted to examine whether religious belief and gender are related in their state.…
A: There are two categorical variables which are gender and belief. We have to test whether gender and…
Q: Morgan City Fire Chief Sidney Pyro is concerned about the low efficiency scores that his…
A: Note: Thank you for the question. Since multiple subparts are posted, according to our policy, we…
Q: In a volunteer group, adults 21 and older volunteer between 1 and 9 hours each week. The program…
A: The row totals and column totals are, 1-3 hours 4-6 hours 7-9 hours Total Community college…
Q: According to national data, 17% of U.S. college students are a member of a sorority or a fraternity.…
A: Q.1 - Solution : Given that :-According to national data, 17% of U.S. college students are a member…
Q: more bactena than oms. The table shows the wanted to determine if carpeted rooms results for the…
A: Solution: Given: See the attached Excel file . Carpeted Mean (X¯1)=9.825 Standard Deviation…
Q: b. Identify the test statistic for this hypothesis test. c. Identify the P-value for this…
A: The test is to check the claim that the proportion of subjects who respond in favour is 0.5.…
Q: A doctor released the results of clinical trials for a vaccine to prevent a particular disease. In…
A: Given ,In group 1No of children n1=100,000No of children who developed disease X1=23In group 2No…
Q: Winter visitors are extremely important to the economy of Southwest Florida. Hotel occupancy is an…
A: The test is to check whether there has been an increase in the proportion of rooms occupied over the…
Q: Are the requirements met to test a hypothesis for the following two population proportions? If not,…
A: Conditions for testing the population proportion: The samples should be selected at random. The…
Q: A school psychologist designed a study to investigate the effectiveness of three study programs. A…
A: Given information: The data of n = 30 students is provided as: Program A: 12, 10, 15, 9, 8, 12, 6,…
Q: An advertising agency collected a random sample of 300 businesses targeted with an advertising…
A: Given: An advertising agency collected a random sample of 300 businesses targeted with an…
Q: An advertising agency collected a random sample of 300 businesses targeted with an advertising…
A: Given problem is hypothesis testing of population proportion n= Random sample=300 x=No. of items of…
Q: An advertising agency collected a random sample of 300 businesses targeted with an advertising…
A:
Q: An advertising agency collected a random sample of 300 businesses targeted with an advertising…
A:
Q: A social psychologist was interested in finding out whether the effect of leadership style on the…
A: For Democratic Leadership: For Autocratic Leadership:
Q: The following MINITAB output presents the results of a hypothesis test for the difference P1 - P2…
A: The values missed in the table will be obtained as given below: (a)
Q: Find the P value for the indicated hypothesis test
A: Sample proportion = 47/100 = 0.47 Test statistics = (Sample proportion-p)/ (p(1-p)/n) =…
Q: An advertising agency collected a random sample of 300 businesses targeted with an advertising…
A: The population is the entire group about which the sample is taken. The sample is a subset of the…
Q: Morgan City Fire Chief Sidney Pyro is concerned about the low efficiency scores that his…
A: A two-sample independent t-test is performed to test if there is a statistically significant…
Q: To examine the relationship between texting and driving skill, a researcher uses orange cones to set…
A: Introduction: Denote μ1, μ2 as the true mean number of orange cones hit by the students while…
Q: A snack food company produces a 454g bag of pretzels. Although the actual net weights deviate…
A: ANS#- Given, A snack food company produces a 454g bag of pretzels. Although the actual net weights…
Q: If you use a 0.05 level of significance in a two-tail hypothesis test, what decision will you make…
A: Alpha = 0.05 Two tailed test Zstat = 1.2
Q: Find the P-value of z-score (3.55) if doing a two-tail hypothesis test.
A:
Q: A national publishing house claims that 45% of all weekly magazine readers in South Africa read…
A:
Q: If you use a 0.05 level of significance in a two-tail hypothesis test, what decision will you make…
A: Given ZSTAT=-1.52, ɑ=0.05 Two tailed hypothesis
Q: Perform the test of hypothesis on the following scenarios. A brand of powdered milk is advertised as…
A: The question is about hypo. testing for a popl. mean Given : Popl. mean of net weight of milk cans (…
Q: Find the P -value for the indicated hypothesis test. A medical school claims that more than 28% of…
A: When the value of sample size is 30 or more we say that it is a large sample. in the large sample,…
Q: If you use a 0.05 level of significance in a two tail hypothesis test, what decision will you make…
A: According to the provided information, level of significance (α) = 0.05 z = 2.21 The z-critical…
Q: Identify the test statistic for this hypothesis test. c. Identify the P-value for this hypothesis…
A: The population proportion is given as, P = 0.10 The sample size, n = 378 & the number of…
Q: The test value is: (round to 3 decimal places) The p-value is (round to 3 decimal places) So…
A: Here it is given that in a volunteer group, adults 21 and older volunteer between 1 and 9 hours each…
Q: The local Hannaford is tracking mask compliance in their stores. In mid-March they found that only…
A:
Q: Find the P-value for the indicated hypothesis test. In a sample of 47 adults selected randomly from…
A:
Q: An advertising agency collected a random sample of 300 businesses targeted with an advertising…
A:
Q: You come across Professor Cafferty's data set from his Master's thesis and realize that he has data…
A: Claim : they received financial support from their family.
Q: There is not enough statistical evidence to suggest that gender and belief about human origins are…
A: Given : religious texts evolutionary theory total male 30 36 66 female 110 89 199 total…
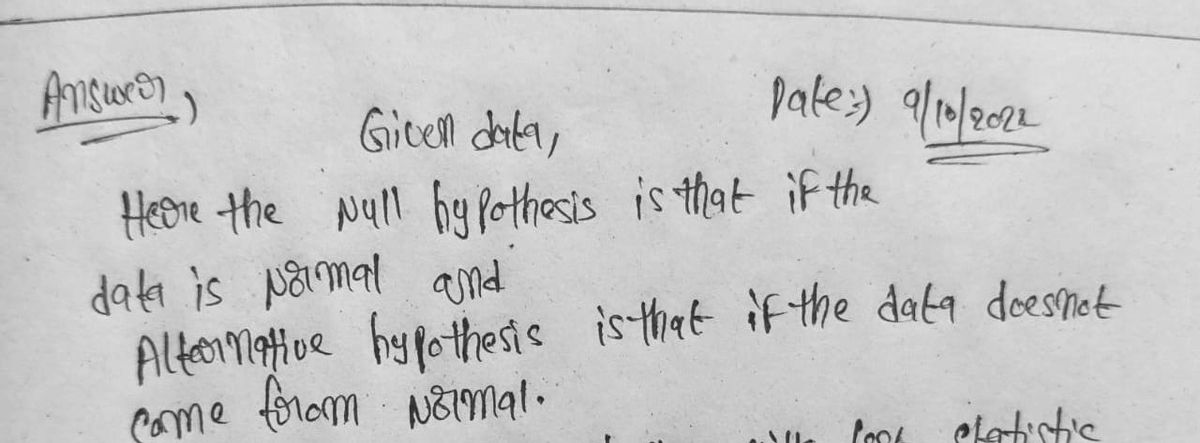
The following computer output was used as a part of the model adequacy check. Conduct the appropriate hypothesis testing based on the output using the standard 6 step apor
Step by step
Solved in 2 steps with 2 images
- A lecturer at WIN wanted to know if he can predict student’s quiz results by asking them to complete a simple survey. The result of the survey is found in the file: Assignment 2 sem22020 data set 1.Quiz ResultActual Mark (0-15) for quiz student attainedEQRQuiz score (0-15) expected to get before taking the quizStudy Hrs.Number of hours per week (on average) spent studying for StatisticsAgeAge (in years)BBTSatisfaction rating of Big Bang TheorySexM=1 F=0MBMB=1 for good math background, otherwise 0MCMC= 1 if math centre is used regularly, otherwise 0AuHSAuHS = 1 if student completed high school in Australia, otherwise 0LMLM=1 if student likes math, 0 otherwiseTask 1: Variable List(a) Using the variables listed in the table above, Describe each variable.(b) State for each variable whether it is qualitative or quantitative; if it is qualitative, state whether it is nominal or ordinal, and if it is quantitative, state whether it is discrete or continuous.Task 2: HistogramCreate a histogram…Q3\Create the FDD table for the given data set. Use it to interpolate of consumption for year(1955?.A\For a linear interpolation use the points x=202.7 and x=322.9.B\For a quadratic interpolation use the points x=202.7 , x=322.9 and x=411.2Can anyone please send me the normal standard table
- Dr. V. noticed that the more frequently a student is late or absent from class the worse he or she performs on the final exam. He decided to investigate. Dr. V. collected a random sample of 22 students. This sample includes the number of times a student is absent and their grades on the final exam. The data can be found in the Excel file Assignment10.xlsx. Do not use any software that I did not assign. Times Late/ Final Exam Absent Grade 9 84.00 92.50 12 52.00 5 87.00 11 75.00 24 45.00 39.00 10 46.00 19 63.00 2 65.00 2 98.00 17 24.50 8 58.00 20 69.50 55 49.00 23 68.50 70.00 4 75.50 2 85.00 97.00 2 97.00 2 93.50 93.50 2 78.00 2 86.00 2 88.00 Question 1: Which or the two variables (times absent or grades on the final exam) is the independent variable and which is the dependent variable? Question 2: Using Microsoft Excel: (Excel file Assignment10.xlsx) SHOW YOUR WORK а. Count the number of XY variables. b. Calculate the mean and sample standard deviation of both the independent and…Dr. V. noticed that the more frequently a student is late or absent from class the worse he or she performs on the final exam. He decided to investigate. Dr. V. collected a random sample of 22 students. This sample includes the number of times a student is absent and their grades on the final exam. The data can be found in the Excel file Assignment10.xlsx. Do not use any software that I did not assign. Times Late/ Final Exam Absent Grade 9 84.00 2 92.50 12 52.00 5 87.00 11 75.00 24 45.00 7 39.00 10 46.00 19 63.00 2 65.00 2 98.00 17 24.50 8 58.00 20 69.50 55 49.00 23 68.50 70.00 4 75.50 85.00 7 97.00 2 97.00 93.50 93.50 2 78.00 2 86.00 2 88.00 Question 1: Which or the two variables (times absent or grades on the final exam) is the independent variable and which is the dependent variable?The foreign automobile dealer sells English, French, German, Japanese and Korean automobiels. Th enumber of such automobiles sold in a month follow; Country English French German Japanese Korean Number 3. 12 20 10 In words describe what descriptive method would you use to display the data to an audience? Comment on your choice. For the toolbar, press ALT+F10 (PC) or ALT+FN+F10 (Mac).
- Define the equation is used to predict HSGPA from SAT?A statistics professor for STAT 250 wants to investigate how long it takes students to complete Exam 1. The times that it took all 715 STAT 250 students in Spring 2022 were recorded in the data set “Time to Complete Exam 1” found in StatCrunch. The time is recorded in minutes. A student who completed the exam in 50:30 (50 minutes and 30 seconds) would be recorded as 50.5 minutes Column Mean Std. dev. Sample 26 (Time) 43.93 7.14 1) Does the mean calculated come from a sampling distribution that is approximately Normal? Check all three conditions of the Central Limit Theorem using one complete sentence for each condition to answer this question 2) Calculate the probability that, in a random sample of 26 students, the mean time to complete Exam 1 is 50 minutes or more. Complete this part by standardizing and using the Standard Normal Table to obtain this probability. Show all work and type all calculations.What is curve fitting and polynomial interpolation