Use java. Random rand = new Random(), for loop, for nested loop Run 5 simulations of 10 districts The requirements is on the image 1 See image2 for the expected output. For the results: suppose that left represents our candidate, and right represent the opponent candidates. The number is equals to the total vote received in 10 districts
Use java. Random rand = new Random(), for loop, for nested loop Run 5 simulations of 10 districts The requirements is on the image 1 See image2 for the expected output. For the results: suppose that left represents our candidate, and right represent the opponent candidates. The number is equals to the total vote received in 10 districts
Database System Concepts
7th Edition
ISBN:9780078022159
Author:Abraham Silberschatz Professor, Henry F. Korth, S. Sudarshan
Publisher:Abraham Silberschatz Professor, Henry F. Korth, S. Sudarshan
Chapter1: Introduction
Section: Chapter Questions
Problem 1PE
Related questions
Question
Use java. Random rand = new Random(), for loop, for nested loop
Run 5 simulations of 10 districts
The requirements is on the image 1
See image2 for the expected output.
For the results: suppose that left represents our candidate, and right represent the opponent candidates. The number is equals to the total vote received in 10 districts

Transcribed Image Text:**Simulating the Election**
Your program will run a series of simulations of the same election. Each simulation will be run as follows:
1. **For each district:**
1. Randomly determine how many people voted in this district.
2. Randomly determine what percentage of the vote our candidate received in this district.
3. Multiply these two values together to compute how many votes our candidate received in this district.
4. Add the number of votes our candidate received and the total number of votes cast in this district to the overall totals.
2. Compute the overall percentage of the vote our candidate received across all districts.
3. Print out the results (see below).
4. Add the turnout and votes earned in this simulation to the overall totals (see below).
Your program should execute this entire procedure (including the output) for each simulation. After all simulations have been run, your program should all print out the average vote percentage our candidate received across all simulations. (If we’ve done things right, that should be pretty close to the polling average, though it won't exactly match.)

Transcribed Image Text:**Simulation Results Explanation:**
- **Running simulation #1:**
- **Win?:** false
- **Results:**
- First value: 2064 (49.891225525743295%)
- Second value: 2073 (50.108774474256705%)
The simulation details the outcomes of a computational model. It indicates the first outcome did not result in a win. The two results are numerical values representing different data points or categories, each with a corresponding percentage of total occurrences. The first result is marginally less frequent than the second, indicating a close outcome between the two scenarios being simulated.
Expert Solution
This question has been solved!
Explore an expertly crafted, step-by-step solution for a thorough understanding of key concepts.
This is a popular solution!
Trending now
This is a popular solution!
Step by step
Solved in 3 steps with 3 images

Follow-up Questions
Read through expert solutions to related follow-up questions below.
Follow-up Question
Thank you. But can you only use Boolean to printed out whether is true or false? Because we haven't learn the if, else if yet. Further, see the images for more requirements.
Thank you

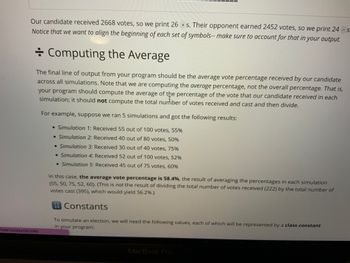
Transcribed Image Text:Our candidate received 2668 votes, so we print 26 + s. Their opponent earned 2452 votes, so we print 24 - s
Notice that we want to align the beginning of each set of symbols-- make sure to account for that in your output.
Computing the Average
The final line of output from your program should be the average vote percentage received by our candidate
across all simulations. Note that we are computing the average percentage, not the overall percentage. That is,
your program should compute the average of the percentage of the vote that our candidate received in each
simulation; it should not compute the total nurfiber of votes received and cast and then divide.
5987/slides/263085
For example, suppose we ran 5 simulations and got the following results:
• Simulation 1: Received 55 out of 100 votes, 55%
• Simulation 2: Received 40 out of 80 votes, 50%
• Simulation 3: Received 30 out of 40 votes, 75%
• Simulation 4: Received 52 out of 100 votes, 52%
• Simulation 5: Received 45 out of 75 votes, 60%
In this case, the average vote percentage is 58.4%, the result of averaging the percentages in each simulation
(55, 50, 75, 52, 60). (This is not the result of dividing the total number of votes received (222) by the total number of
votes cast (395), which would yield 56.2%.)
Constants
To simulate an election, we will need the following values, each of which will be represented by a class constant
in your program:
12
34
MacBook Pro

Transcribed Image Text:7
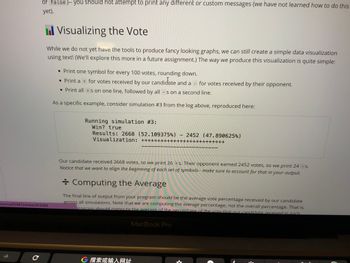
or false)-- you should not attempt to print any different or custom messages (we have not learned how to do this
yet).
essons/45987/slides/263085
с
Visualizing the Vote
While we do not yet have the tools to produce fancy looking graphs, we can still create a simple data visualization
using text! (We'll explore this more in a future assignment.) The way we produce this visualization is quite simple:
• Print one symbol for every 100 votes, rounding down.
• Print a + for votes received by our candidate and a
• Print all +s on one line, followed by all -s on a second line.
As a specific example, consider simulation #3 from the log above, reproduced here:
Running simulation #3:
Win? true
Results: 2668 (52.109375%)
Visualization: ++++
-
MacBook Pro
G 搜索或输入网址
-
+++++-
for votes received by their opponent.
2452 (47.890625%)
Our candidate received 2668 votes, so we print 26 + s. Their opponent earned 2452 votes, so we print 24 - s.
Notice that we want to align the beginning of each set of symbols-- make sure to account for that in your output.
++++++++++++++
+ Computing the Average
The final line of output from your program should be the average vote percentage received by our candidate
across all simulations. Note that we are computing the average percentage, not the overall percentage. That is,
brogram should compute the average of the percentage of the vote that our candidate received in each
Solution
Follow-up Question
Thank you but the output should be like this

Transcribed Image Text:Running simulation #1:
Win? false
Results: 2064 (49.891225525743295%) - 2073 (50.108774474256705%)
Solution
Knowledge Booster
Learn more about
Need a deep-dive on the concept behind this application? Look no further. Learn more about this topic, computer-science and related others by exploring similar questions and additional content below.Recommended textbooks for you

Database System Concepts
Computer Science
ISBN:
9780078022159
Author:
Abraham Silberschatz Professor, Henry F. Korth, S. Sudarshan
Publisher:
McGraw-Hill Education

Starting Out with Python (4th Edition)
Computer Science
ISBN:
9780134444321
Author:
Tony Gaddis
Publisher:
PEARSON

Digital Fundamentals (11th Edition)
Computer Science
ISBN:
9780132737968
Author:
Thomas L. Floyd
Publisher:
PEARSON

Database System Concepts
Computer Science
ISBN:
9780078022159
Author:
Abraham Silberschatz Professor, Henry F. Korth, S. Sudarshan
Publisher:
McGraw-Hill Education

Starting Out with Python (4th Edition)
Computer Science
ISBN:
9780134444321
Author:
Tony Gaddis
Publisher:
PEARSON

Digital Fundamentals (11th Edition)
Computer Science
ISBN:
9780132737968
Author:
Thomas L. Floyd
Publisher:
PEARSON

C How to Program (8th Edition)
Computer Science
ISBN:
9780133976892
Author:
Paul J. Deitel, Harvey Deitel
Publisher:
PEARSON

Database Systems: Design, Implementation, & Manag…
Computer Science
ISBN:
9781337627900
Author:
Carlos Coronel, Steven Morris
Publisher:
Cengage Learning

Programmable Logic Controllers
Computer Science
ISBN:
9780073373843
Author:
Frank D. Petruzella
Publisher:
McGraw-Hill Education