Let's assume that the COVID-19 new case report data were collected from S.A Ministry of Health.30th of December 2019 was the first date that COVID-19 was confirmed in S.A. The time period of data was from the 20th of January to the 27th of January 2020 (for the last 7 days). The data included the total number of new cases, date of recorded, number of new total COVID-19 cases. In this study, a medical researcher used Pearson's cortelation analysis and the linear regression model to predict COVID-19 new cases based on the available data. (e.g., that Cases of infection rises linearly with number of people tested). The best-known types of regression analysis are the following: Date 2020/01/20 2020/01/21 2020/01/22 2020/01/23 2020/01/24 2020/01/25 2020/01/26 2020/01/27 Day Sunday Monday Tuesday Wednesday Thursday Friday Saturday Sunday Test No. Case Counts 1 33 41 17 1 18 13 44 Calculate the coefficient of correlation using the Karl Pearson method. OA. 1 OB0.1356 OC.0.9239 O D.-0.0598
Let's assume that the COVID-19 new case report data were collected from S.A Ministry of Health.30th of December 2019 was the first date that COVID-19 was confirmed in S.A. The time period of data was from the 20th of January to the 27th of January 2020 (for the last 7 days). The data included the total number of new cases, date of recorded, number of new total COVID-19 cases. In this study, a medical researcher used Pearson's cortelation analysis and the linear regression model to predict COVID-19 new cases based on the available data. (e.g., that Cases of infection rises linearly with number of people tested). The best-known types of regression analysis are the following: Date 2020/01/20 2020/01/21 2020/01/22 2020/01/23 2020/01/24 2020/01/25 2020/01/26 2020/01/27 Day Sunday Monday Tuesday Wednesday Thursday Friday Saturday Sunday Test No. Case Counts 1 33 41 17 1 18 13 44 Calculate the coefficient of correlation using the Karl Pearson method. OA. 1 OB0.1356 OC.0.9239 O D.-0.0598

MATLAB: An Introduction with Applications
6th Edition
ISBN:9781119256830
Author:Amos Gilat
Publisher:Amos Gilat
Chapter1: Starting With Matlab
Section: Chapter Questions
Problem 1P

Related questions
Question

Transcribed Image Text:Let's assume that the COVID-19 new case report data were collected from S.A Ministry of Health 30th of December 2019 was the first date that COVID-19 was confirmed in
S.A. The time period of data was from the 20th of January to the 27th of January 2020 (for the last 7 days). The data included the total number of new cases, date of recorded,
number of new total COVID-19 cases. In this study, a medical researcher used Pearson's cortelation analysis and the linear regression model to predict COVID-19 new cases
based on the available data. (e.g., that Cases of infection rises linearly with number of people tested). The best-known types of regression analysis are the following:
Date
Day
Sunday
Monday
Tuesday
Wednesday
Thursday
Friday
Saturday
Sunday
Test No.
Case Counts
2020/01/20
2020/01/21
2020/01/22
2020/01/23
2020/01/24
2020/01/25
2020/01/26
2020/01/27
6.
33
41
17
1
18
3.
13
44
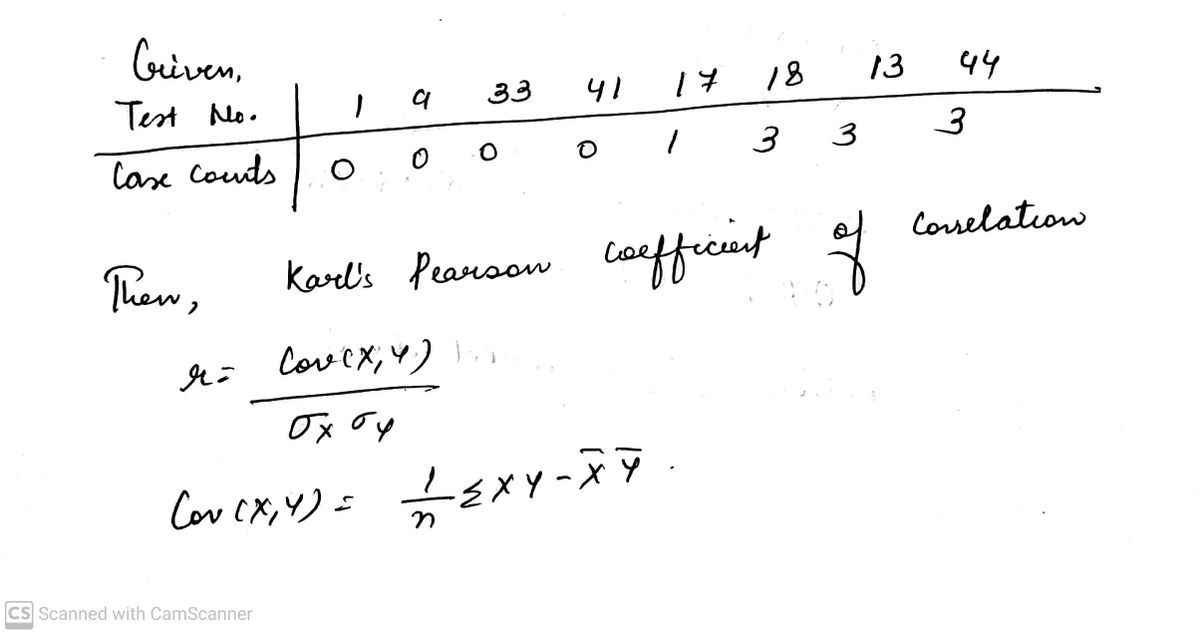
Calculate the coefficient of correlation using the Karl Pearson method.
O A. 1
OB. 0.1356
OC. 0.9239
OD. -0.0598
Expert Solution
Step 1

Step by step
Solved in 3 steps with 3 images

Recommended textbooks for you
MATLAB: An Introduction with Applications
Statistics
ISBN:
9781119256830
Author:
Amos Gilat
Publisher:
John Wiley & Sons Inc

Probability and Statistics for Engineering and th…
Statistics
ISBN:
9781305251809
Author:
Jay L. Devore
Publisher:
Cengage Learning

Statistics for The Behavioral Sciences (MindTap C…
Statistics
ISBN:
9781305504912
Author:
Frederick J Gravetter, Larry B. Wallnau
Publisher:
Cengage Learning
MATLAB: An Introduction with Applications
Statistics
ISBN:
9781119256830
Author:
Amos Gilat
Publisher:
John Wiley & Sons Inc
Probability and Statistics for Engineering and th…
Statistics
ISBN:
9781305251809
Author:
Jay L. Devore
Publisher:
Cengage Learning
Statistics for The Behavioral Sciences (MindTap C…
Statistics
ISBN:
9781305504912
Author:
Frederick J Gravetter, Larry B. Wallnau
Publisher:
Cengage Learning

Elementary Statistics: Picturing the World (7th E…
Statistics
ISBN:
9780134683416
Author:
Ron Larson, Betsy Farber
Publisher:
PEARSON

The Basic Practice of Statistics
Statistics
ISBN:
9781319042578
Author:
David S. Moore, William I. Notz, Michael A. Fligner
Publisher:
W. H. Freeman

Introduction to the Practice of Statistics
Statistics
ISBN:
9781319013387
Author:
David S. Moore, George P. McCabe, Bruce A. Craig
Publisher:
W. H. Freeman