Lab 3-Descriptive statistics This lab has 3 parts. All 3 parts must be submitted as one document. Part 1: Examining data This activity closely aligns with §2.8 from the OpenStax textbook 1. Randomly survey 30 classmates regarding the number of pairs of shoes they own. Record the values below. 2. Calculate the following values x = S= 3. Are the data discrete or continuous? How do you know?
Lab 3-Descriptive statistics This lab has 3 parts. All 3 parts must be submitted as one document. Part 1: Examining data This activity closely aligns with §2.8 from the OpenStax textbook 1. Randomly survey 30 classmates regarding the number of pairs of shoes they own. Record the values below. 2. Calculate the following values x = S= 3. Are the data discrete or continuous? How do you know?
MATLAB: An Introduction with Applications
6th Edition
ISBN:9781119256830
Author:Amos Gilat
Publisher:Amos Gilat
Chapter1: Starting With Matlab
Section: Chapter Questions
Problem 1P
Related questions
Question

Transcribed Image Text:Lab 3 - Descriptive statistics
This lab has 3 parts. All 3 parts must be submitted as one document.
4.
Part 1: Examining data
This activity closely aligns with §2.8 from the OpenStax textbook
1.
values below.
Randomly survey 30 classmates regarding the number of pairs of shoes they own. Record the
2. Calculate the following values
X =
S =
3. Are the data discrete or continuous? How do you know?
Construct a histogram, with five or six intervals, using StatCrunch. Attach a print out to your work.
5.
Using complete sentences, describe the shape of the histogram you created in the previous
problem.
Expert Solution
This question has been solved!
Explore an expertly crafted, step-by-step solution for a thorough understanding of key concepts.
This is a popular solution!
Trending now
This is a popular solution!
Step by step
Solved in 4 steps

Follow-up Questions
Read through expert solutions to related follow-up questions below.
Follow-up Question

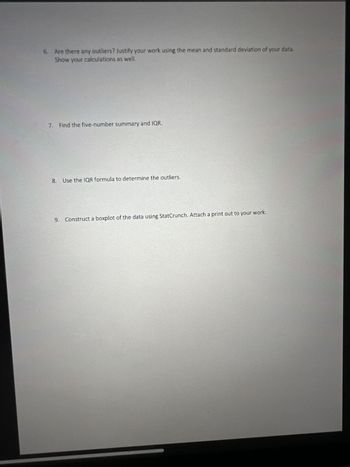
Transcribed Image Text:6. Are there any outliers? Justify your work using the mean and standard deviation of your data.
Show your calculations as well.
7. Find the five-number summary and IQR.
8.
Use the IQR formula to determine the outliers.
9. Construct a boxplot of the data using StatCrunch. Attach a print out to your work.
Solution
Recommended textbooks for you

MATLAB: An Introduction with Applications
Statistics
ISBN:
9781119256830
Author:
Amos Gilat
Publisher:
John Wiley & Sons Inc

Probability and Statistics for Engineering and th…
Statistics
ISBN:
9781305251809
Author:
Jay L. Devore
Publisher:
Cengage Learning

Statistics for The Behavioral Sciences (MindTap C…
Statistics
ISBN:
9781305504912
Author:
Frederick J Gravetter, Larry B. Wallnau
Publisher:
Cengage Learning

MATLAB: An Introduction with Applications
Statistics
ISBN:
9781119256830
Author:
Amos Gilat
Publisher:
John Wiley & Sons Inc

Probability and Statistics for Engineering and th…
Statistics
ISBN:
9781305251809
Author:
Jay L. Devore
Publisher:
Cengage Learning

Statistics for The Behavioral Sciences (MindTap C…
Statistics
ISBN:
9781305504912
Author:
Frederick J Gravetter, Larry B. Wallnau
Publisher:
Cengage Learning

Elementary Statistics: Picturing the World (7th E…
Statistics
ISBN:
9780134683416
Author:
Ron Larson, Betsy Farber
Publisher:
PEARSON

The Basic Practice of Statistics
Statistics
ISBN:
9781319042578
Author:
David S. Moore, William I. Notz, Michael A. Fligner
Publisher:
W. H. Freeman

Introduction to the Practice of Statistics
Statistics
ISBN:
9781319013387
Author:
David S. Moore, George P. McCabe, Bruce A. Craig
Publisher:
W. H. Freeman