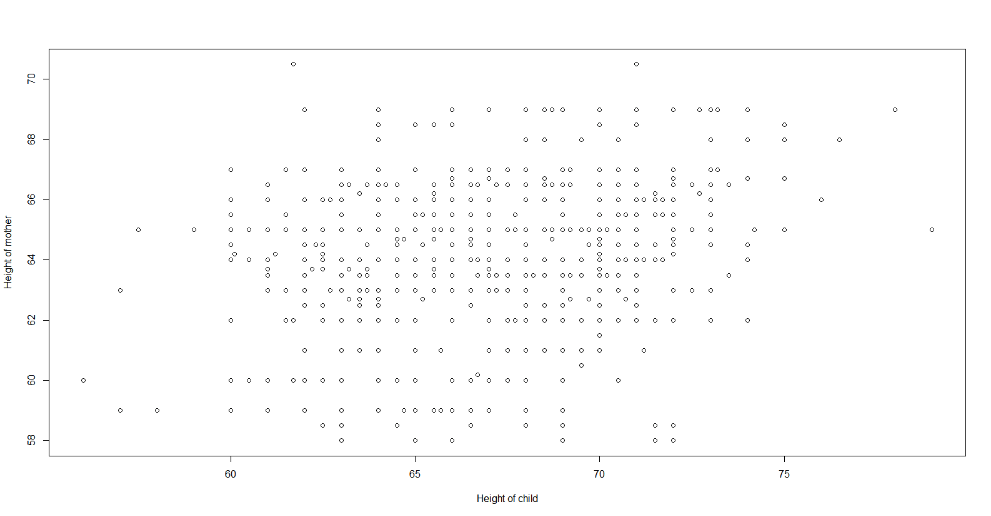
We'll look at the Galton data frame from the mosaicData package: data(Galton) View(Galton) help(Galton) Here's a scatterplot of the heights of the mothers and the heights of their children: ***(YOU MUST CREATE THE SCATTERPLOT FROM INFO GIVEN) We would like to use the data to predict the height of a child from the height of her mother. As described in class and in the Course Notes, use the predict() function to predict the height of a child (the time of Galtons' study) if the child's mother was known to be 64 inches tall. Record your answer (without units) as a decimal number, correct to at least two decimal places.
We'll look at the Galton data frame from the mosaicData package:
data(Galton)
View(Galton)
help(Galton)
Here's a
***(YOU MUST CREATE THE SCATTERPLOT FROM INFO GIVEN)
We would like to use the data to predict the height of a child from the height of her mother. As described in class and in the Course Notes, use the predict()
R-code for scatterplot
############
library(mosaicData)
#loading data
data(Galton)
x=as.data.frame(cbind(Galton$height,Galton$mother))
# scatterplot
plot(x[,1],x[,2],xlab = "Height of child",ylab = "Height of mother")
#####################
Scatterplot

Trending now
This is a popular solution!
Step by step
Solved in 2 steps with 1 images


