In the attached pic, equipotential lines with their electric potential values are given 1. Draw the electric field vector at each of the points A, B & C
In the attached pic, equipotential lines with their electric potential values are given 1. Draw the electric field vector at each of the points A, B & C

Related questions
Question
![### Equipotential Lines and Electric Field Vectors
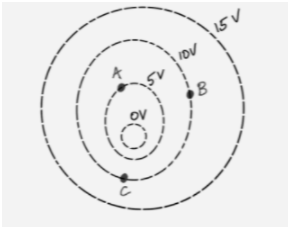
In the provided diagram, we observe equipotential lines with labeled electric potential values of 0V, 5V, 10V, and 15V. Points A, B, and C are marked on these lines.
#### Analysis of the Diagram:
- The equipotential lines form concentric circles.
- As the electric potential increases from the center outward, the values change from 0V (innermost circle) to 15V (outermost circle).
#### Questions:
1. **Draw the electric field vector at each of the points A, B, and C:**
- The electric field vector is always perpendicular to the equipotential lines and points in the direction of decreasing potential. Therefore, at:
- **Point A (on 5V line):** The electric field vector points radially inward toward the 0V line.
- **Point B (on 10V line):** The electric field vector points radially inward toward the 5V line.
- **Point C (on 0V line):** Since this is the innermost point, the electric field vector is minimal or zero as it is typically directed outward.
2. **Calculate the change in Electrical Potential Energy when a proton (with positive charge +e) is moved from B to C:**
- The change in potential energy, ΔU, is given by the formula:
\[
\Delta U = q \times \Delta V
\]
- Here, \( q = +e \) (the charge of a proton) and \(\Delta V = V_C - V_B = 0V - 10V = -10V\).
- Therefore, \(\Delta U = +e \times (-10V) = -10eV\).
- This indicates a decrease in electrical potential energy as the proton moves from a higher potential (10V) to a lower potential (0V).
This exercise illustrates how equipotential lines help visualize the electric field and potential energy changes within an electric field.](/v2/_next/image?url=https%3A%2F%2Fcontent.bartleby.com%2Fqna-images%2Fquestion%2F8250c86c-ed6e-43af-9ad5-e34c083140fb%2Faffae1ca-03ca-4491-956b-00a82855b607%2Fwd53ghh_processed.png&w=3840&q=75)
Transcribed Image Text:### Equipotential Lines and Electric Field Vectors
In the provided diagram, we observe equipotential lines with labeled electric potential values of 0V, 5V, 10V, and 15V. Points A, B, and C are marked on these lines.
#### Analysis of the Diagram:
- The equipotential lines form concentric circles.
- As the electric potential increases from the center outward, the values change from 0V (innermost circle) to 15V (outermost circle).
#### Questions:
1. **Draw the electric field vector at each of the points A, B, and C:**
- The electric field vector is always perpendicular to the equipotential lines and points in the direction of decreasing potential. Therefore, at:
- **Point A (on 5V line):** The electric field vector points radially inward toward the 0V line.
- **Point B (on 10V line):** The electric field vector points radially inward toward the 5V line.
- **Point C (on 0V line):** Since this is the innermost point, the electric field vector is minimal or zero as it is typically directed outward.
2. **Calculate the change in Electrical Potential Energy when a proton (with positive charge +e) is moved from B to C:**
- The change in potential energy, ΔU, is given by the formula:
\[
\Delta U = q \times \Delta V
\]
- Here, \( q = +e \) (the charge of a proton) and \(\Delta V = V_C - V_B = 0V - 10V = -10V\).
- Therefore, \(\Delta U = +e \times (-10V) = -10eV\).
- This indicates a decrease in electrical potential energy as the proton moves from a higher potential (10V) to a lower potential (0V).
This exercise illustrates how equipotential lines help visualize the electric field and potential energy changes within an electric field.
Expert Solution
Step 1
Given:

Step by step
Solved in 4 steps with 2 images
