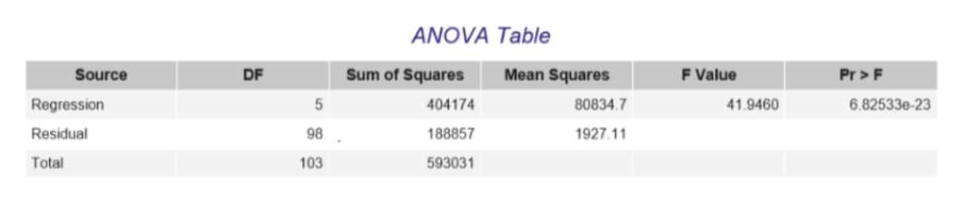
In Problems 5, 6, and 7, we will make some attempts at predicting how good a neighborhood's schools are (median API) from the other variables in the dataset. Problem 5. Our first attempt is a multiple linear regression model using all five of the variables related to ethnicity (Asian, Black, Latino, White, and Diversity). Use the ANOVA table for the model (below) to answer parts A-D. ANOVA Table F Value Source DF Sum of Squares Mean Squares Pr> F 404174 188857 593031 80834.7 41.9460 6.82533e-23 Regression Residual Total 98 1927.11 103 A. State the null and alternative hypothesis for the ANOVA F Test for this multiple linear regression model Find the F statistic and the p-value from the output above, and report their values below B. C. Based on your answer to part B, is the overall model significant at the 1% level? Find the squared multiple correlation coefficient (R2) for this multiple linear regression model Round your answer to 2 decimal places
In Problems 5, 6, and 7, we will make some attempts at predicting how good a neighborhood's schools are (median API) from the other variables in the dataset. Problem 5. Our first attempt is a multiple linear regression model using all five of the variables related to ethnicity (Asian, Black, Latino, White, and Diversity). Use the ANOVA table for the model (below) to answer parts A-D. ANOVA Table F Value Source DF Sum of Squares Mean Squares Pr> F 404174 188857 593031 80834.7 41.9460 6.82533e-23 Regression Residual Total 98 1927.11 103 A. State the null and alternative hypothesis for the ANOVA F Test for this multiple linear regression model Find the F statistic and the p-value from the output above, and report their values below B. C. Based on your answer to part B, is the overall model significant at the 1% level? Find the squared multiple correlation coefficient (R2) for this multiple linear regression model Round your answer to 2 decimal places

MATLAB: An Introduction with Applications
6th Edition
ISBN:9781119256830
Author:Amos Gilat
Publisher:Amos Gilat
Chapter1: Starting With Matlab
Section: Chapter Questions
Problem 1P

Related questions
Question

Transcribed Image Text:In Problems 5, 6, and 7, we will make some attempts at predicting how good a neighborhood's schools
are (median API) from the other variables in the dataset.
Problem 5. Our first attempt is a multiple linear regression model using all five of the variables related
to ethnicity (Asian, Black, Latino, White, and Diversity). Use the ANOVA table for the model (below) to
answer parts A-D.
ANOVA Table
F Value
Source
DF
Sum of Squares
Mean Squares
Pr> F
404174
188857
593031
80834.7
41.9460
6.82533e-23
Regression
Residual
Total
98
1927.11
103
A. State the null and alternative hypothesis for the ANOVA F Test for this multiple linear regression
model
Find the F statistic and the p-value from the output above, and report their values below
B.
C.
Based on your answer to part B, is the overall model significant at the 1% level?
Find the squared multiple correlation coefficient (R2) for this multiple linear regression model
Round your answer to 2 decimal places
Expert Solution
Step 1
Hello there! there are more than 3 sub parts mentioned in the question. According to our policies cannot answer more than three sub parts. Kindly find the solution for parts a, b and c. If you have any doubt in remaining parts kindly make a new request mentioning the part which you need help in.
Step 2
Given ANOVA table for multiple linear regression model using all five of the variables is shown below.
In null hypothesis we generally say that the coefficients of all five variables which are slope parameters are equal to 0.
Null Hypothesis : β1 = β2 =β3 = β4 = β5 = 0.
In alternative Hypothesis we say that the slope parameteres are not equal to 0
Alternative Hypothesis : β1 ≠ β2 ≠β3 ≠ β4 ≠ β5 ≠ 0.

Step by step
Solved in 4 steps with 2 images

Recommended textbooks for you
MATLAB: An Introduction with Applications
Statistics
ISBN:
9781119256830
Author:
Amos Gilat
Publisher:
John Wiley & Sons Inc

Probability and Statistics for Engineering and th…
Statistics
ISBN:
9781305251809
Author:
Jay L. Devore
Publisher:
Cengage Learning

Statistics for The Behavioral Sciences (MindTap C…
Statistics
ISBN:
9781305504912
Author:
Frederick J Gravetter, Larry B. Wallnau
Publisher:
Cengage Learning
MATLAB: An Introduction with Applications
Statistics
ISBN:
9781119256830
Author:
Amos Gilat
Publisher:
John Wiley & Sons Inc
Probability and Statistics for Engineering and th…
Statistics
ISBN:
9781305251809
Author:
Jay L. Devore
Publisher:
Cengage Learning
Statistics for The Behavioral Sciences (MindTap C…
Statistics
ISBN:
9781305504912
Author:
Frederick J Gravetter, Larry B. Wallnau
Publisher:
Cengage Learning

Elementary Statistics: Picturing the World (7th E…
Statistics
ISBN:
9780134683416
Author:
Ron Larson, Betsy Farber
Publisher:
PEARSON

The Basic Practice of Statistics
Statistics
ISBN:
9781319042578
Author:
David S. Moore, William I. Notz, Michael A. Fligner
Publisher:
W. H. Freeman

Introduction to the Practice of Statistics
Statistics
ISBN:
9781319013387
Author:
David S. Moore, George P. McCabe, Bruce A. Craig
Publisher:
W. H. Freeman