In each of Exercises, use the technology of your choice to decide whether applying the t-interval procedure to obtain a confidence interval for the population mean in question appears reasonable. Explain your answers. Shoe and Apparel E-Tailers. In the special report “Mousetrap: The Most-Visited Shoe and Apparel E-tailers” (Footwear News, Vol. 58), we found the following data on the average time, in minutes, spent per user per month from January to June of one year for a sample of 15 shoe and apparel retail websites. 13.3 9.0 11.1 9.1 8.4 15.6 8.1 8.3 13.0 17.1 16.3 13.5 8.0 15.1 5.8


In each of Exercises, use the technology of your choice to decide whether applying the t-interval procedure to obtain a confidence interval for the population
Shoe and Apparel E-Tailers. In the special report “Mousetrap: The Most-Visited Shoe and Apparel E-tailers” (Footwear News, Vol. 58), we found the following data on the average time, in minutes, spent per user per month from January to June of one year for a sample of 15 shoe and apparel retail websites.
| 13.3 | 9.0 | 11.1 | 9.1 | 8.4 |
| 15.6 | 8.1 | 8.3 | 13.0 | 17.1 |
| 16.3 | 13.5 | 8.0 | 15.1 | 5.8 |
The following assumptions are required for the small sample confidence interval about mean to be valid.
Requirements for a small sample confidence interval about mean:
- The sample must be drawn using simple random sampling.
- The population standard deviation must be unknown.
- Either the population must be approximately normal or the sample size must be greater than 30.
Thus, the requirements must be satisfied for the confidence interval about mean using t-distribution to be valid.
Here, the population standard deviation is unknown and the sample is drawn randomly.
That is, first two requirements are satisfied.
Now the case is about the third requirement.
Check for normality:
- If the normal probability plot of the sample produces relatively straight line then the population of the sample is distributed normally.
- There should not be the presence of any outliers in the sample data.
One of the way to check for normality condition is with the normal probability plot:
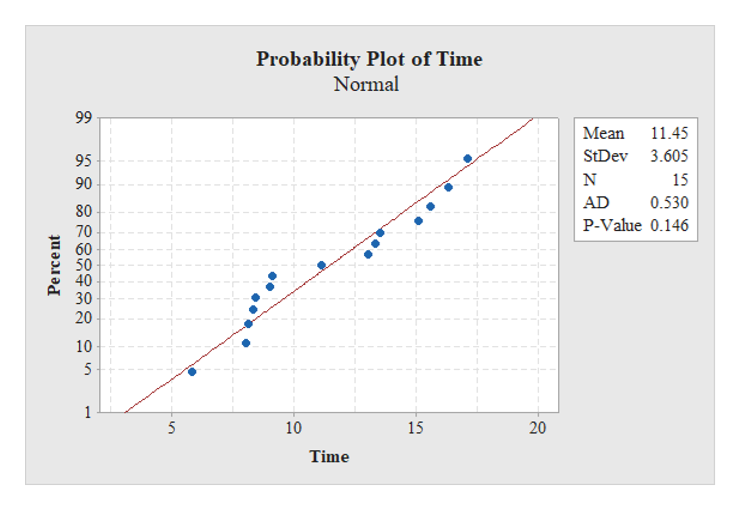
Probability plot:
Step-by-step procedure to draw the normal probability plot using the MINITAB software:
- Choose Graph > Probability Plot.
- Choose Single, and then click OK.
- In Graph variables, enter the column of Time.
- Click OK.
Output obtained from MINITAB is given below:

Step by step
Solved in 4 steps with 2 images


