In an effort to improve the mathematical skills of 20 students, a teacher provides a weekly 1-hour tutoring session. A pre-test is given before the sessions and a post-test is given after. The results are shown here. Test the claim that there was an increase in the scores. at. =0.05. You believe that the population is normally distributed, but you do not know the standard deviation. When calculating difference use Post-test minus Pre- test. post-test 70 67 09 02 84 74 01 00 00 90 80 03 04 70 54 34 52 70 97 90 30 74 67 09 74 Which of the following are the correct hypotheses? o < Prl : °H o(claim) > Prt : "H 0 > Prl : °HO H : Pa > o(claim) 0 = Prt : °H HA: Me # 0(claim) Given that a is 0.05 the critical value is 1.729 The test statistic is round to 3 piaces) The pvalue is round to 3 places) The decision can be made to reject H, do not reject H, The final conclusion is that: OThere is enough evidence to reject the claim that there was an increase in the scores. There is not enough evidence to reject the claim that there was an increase in the scores. There is enough evidence to support the claim that there was an increase in the scores. There is not enough evidence to support the claim that there was an increase in the scores.
In an effort to improve the mathematical skills of 20 students, a teacher provides a weekly 1-hour tutoring session. A pre-test is given before the sessions and a post-test is given after. The results are shown here. Test the claim that there was an increase in the scores. at. =0.05. You believe that the population is normally distributed, but you do not know the standard deviation. When calculating difference use Post-test minus Pre- test. post-test 70 67 09 02 84 74 01 00 00 90 80 03 04 70 54 34 52 70 97 90 30 74 67 09 74 Which of the following are the correct hypotheses? o < Prl : °H o(claim) > Prt : "H 0 > Prl : °HO H : Pa > o(claim) 0 = Prt : °H HA: Me # 0(claim) Given that a is 0.05 the critical value is 1.729 The test statistic is round to 3 piaces) The pvalue is round to 3 places) The decision can be made to reject H, do not reject H, The final conclusion is that: OThere is enough evidence to reject the claim that there was an increase in the scores. There is not enough evidence to reject the claim that there was an increase in the scores. There is enough evidence to support the claim that there was an increase in the scores. There is not enough evidence to support the claim that there was an increase in the scores.

MATLAB: An Introduction with Applications
6th Edition
ISBN:9781119256830
Author:Amos Gilat
Publisher:Amos Gilat
Chapter1: Starting With Matlab
Section: Chapter Questions
Problem 1P

Related questions
Question

Transcribed Image Text:In an effort to improve the mathematical skills of 20
students, a teacher provides a weekly 1-hour tutoring
session. A pre-test is given before the sessions and a
post-test is given after. The results are shown here. Test
the claim that there was an increase in the scores. at.
=0.05. You believe that the population is normally
distributed, but you do not know the standard deviation.
When calculating difference use Post-test minus Pre-
test.
post-test
70
67
09
02
84
74
01
00
00
90
80
03
04
70
54
34
52
70
97
90
30
74
67
09
74
Which of the following are the correct hypotheses?
o < Prl : °H
o(claim)
> Prt : "H
0 > Prl : °HO
H : Pa > o(claim)
0 = Prt : °H
HA: Me # 0(claim)
Given that a is 0.05 the critical value is 1.729
The test statistic is
round to 3 piaces)
The pvalue is
round to 3 places)
The decision can be made to
reject H,
do not reject H,
The final conclusion is that:
OThere is enough evidence to reject the claim that
there was an increase in the scores.
There is not enough evidence to reject the claim that
there was an increase in the scores.
There is enough evidence to support the claim that
there was an increase in the scores.
There is not enough evidence to support the claim
that there was an increase in the scores.
Expert Solution
Step 1
Given information-
Sample size, n = 20
Significance level, α = 0.05
I have used following functions for mean and standard deviation.
=AVERAGE (-5:7)
And standard deviation-
=STDEV.S(-5:7)
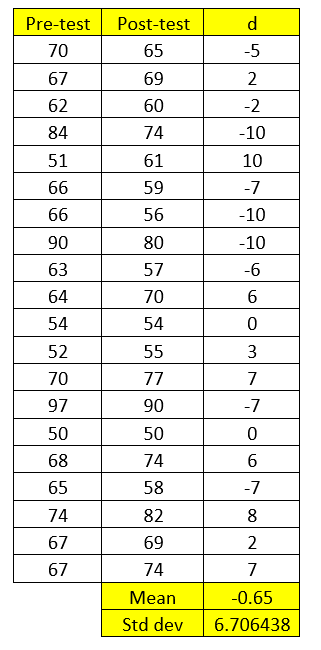
Therefore,
Sample mean, d-bar = -0.65
Sample standard deviation, s = 6.7064

Step by step
Solved in 2 steps with 2 images

Knowledge Booster


Learn more about
Need a deep-dive on the concept behind this application? Look no further. Learn more about this topic, statistics and related others by exploring similar questions and additional content below.Recommended textbooks for you
MATLAB: An Introduction with Applications
Statistics
ISBN:
9781119256830
Author:
Amos Gilat
Publisher:
John Wiley & Sons Inc

Probability and Statistics for Engineering and th…
Statistics
ISBN:
9781305251809
Author:
Jay L. Devore
Publisher:
Cengage Learning

Statistics for The Behavioral Sciences (MindTap C…
Statistics
ISBN:
9781305504912
Author:
Frederick J Gravetter, Larry B. Wallnau
Publisher:
Cengage Learning
MATLAB: An Introduction with Applications
Statistics
ISBN:
9781119256830
Author:
Amos Gilat
Publisher:
John Wiley & Sons Inc
Probability and Statistics for Engineering and th…
Statistics
ISBN:
9781305251809
Author:
Jay L. Devore
Publisher:
Cengage Learning
Statistics for The Behavioral Sciences (MindTap C…
Statistics
ISBN:
9781305504912
Author:
Frederick J Gravetter, Larry B. Wallnau
Publisher:
Cengage Learning

Elementary Statistics: Picturing the World (7th E…
Statistics
ISBN:
9780134683416
Author:
Ron Larson, Betsy Farber
Publisher:
PEARSON

The Basic Practice of Statistics
Statistics
ISBN:
9781319042578
Author:
David S. Moore, William I. Notz, Michael A. Fligner
Publisher:
W. H. Freeman

Introduction to the Practice of Statistics
Statistics
ISBN:
9781319013387
Author:
David S. Moore, George P. McCabe, Bruce A. Craig
Publisher:
W. H. Freeman