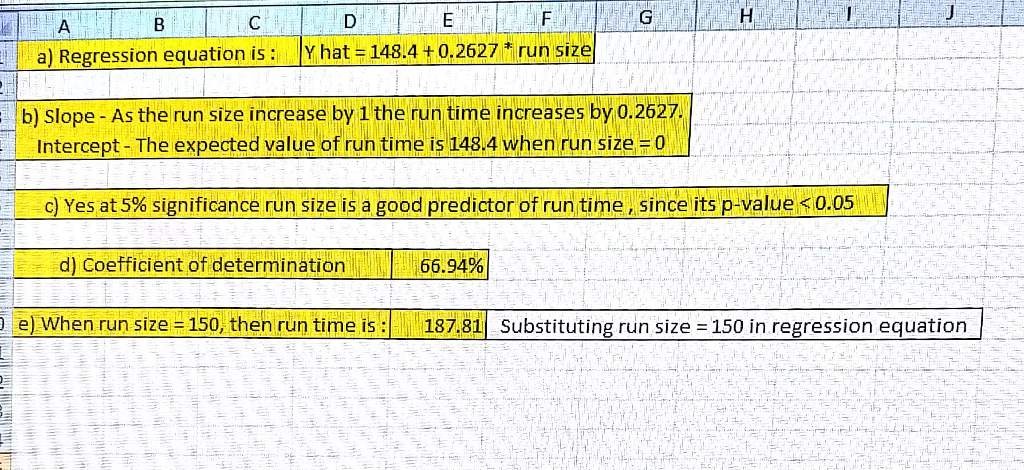
In a production process, the time (in minutes) taken (run time) for a production run and the number of items produced (run size) for 15 randomly selected orders are analyzed using Minitab statistical software. The Minitab output is as follows: Regression Analysis: Run time versus Run size Analysis of Variance Source DF Adj SS Adj MS F-Value Critical value Regression 1 8737.1 8737.1 29.35 ……… Error 13 3870.5 297.7 Total 14 12607.6 Model Summary S R-sq R-sq(adj) R-sq(pred) 17.2549 ……. 66.94% 61.32% Coefficients Term Coef SE Coef T-Value P-Value VIF Constant 148.4 11.3 13.13 0.000 Run size 0.2627 0.0485 ……. ……. 1.00 1- Calculate the coefficient of determination and interpret its meaning in the context of the production process. 2- If in a run 150 items are produced, predict the run time.


In a production process, the time (in minutes) taken (run time) for a production run and the number of items produced (run size) for 15 randomly selected orders are analyzed using Minitab statistical software. The Minitab output is as follows:
Analysis of Variance
|
Source |
DF |
Adj SS |
Adj MS |
F-Value |
Critical value |
|
Regression |
1 |
8737.1 |
8737.1 |
29.35 |
……… |
|
Error |
13 |
3870.5 |
297.7 |
|
|
|
Total |
14 |
12607.6 |
|
|
|
Model Summary
|
S |
R-sq |
R-sq(adj) |
R-sq(pred) |
|
17.2549 |
……. |
66.94% |
61.32% |
Coefficients
|
Term |
Coef |
SE Coef |
T-Value |
P-Value |
VIF |
||
|
Constant |
148.4 |
11.3 |
13.13 |
0.000 |
|
||
|
Run size |
0.2627 |
0.0485 |
……. |
……. |
1.00 |
||
|
|
|
|
|||||
1- Calculate the coefficient of determination and interpret its meaning in the context of the production process.
2- If in a run 150 items are produced, predict the run time.

Step by step
Solved in 2 steps with 1 images


