The numbers of false fire alarms were counted each month at a number of sites. The results are given in the following table. Number of Alarms 37 42 26 36 36 31 35 35 44 25 26 42 Test the hypothesis that false alarms are equally likely to occur in any month. Use 10% level of significanc Procedure: Select an answer Assumptions: (select everything that applies) Month January February March April May June July August September October November December Independent samples At most 20% of the expected frequencies are less than 5 Equal population standard deviations Normal populations All expected frequencies are 1 or greater Simple random sample
The numbers of false fire alarms were counted each month at a number of sites. The results are given in the following table. Number of Alarms 37 42 26 36 36 31 35 35 44 25 26 42 Test the hypothesis that false alarms are equally likely to occur in any month. Use 10% level of significanc Procedure: Select an answer Assumptions: (select everything that applies) Month January February March April May June July August September October November December Independent samples At most 20% of the expected frequencies are less than 5 Equal population standard deviations Normal populations All expected frequencies are 1 or greater Simple random sample
MATLAB: An Introduction with Applications
6th Edition
ISBN:9781119256830
Author:Amos Gilat
Publisher:Amos Gilat
Chapter1: Starting With Matlab
Section: Chapter Questions
Problem 1P
Related questions
Question

Transcribed Image Text:The numbers of false fire alarms were counted each month at a number of sites. The results are given in
the following table.
Number of Alarms
37
42
26
36
36
31
35
35
44
25
26
42
Test the hypothesis that false alarms are equally likely to occur in any month. Use 10% level of significance.
Procedure: Select an answer
Assumptions: (select everything that applies)
Month
January
February
March
April
May
June
July
August
September
October
November
December
Independent samples
At most 20% of the expected frequencies are less than 5
Equal population standard deviations
Normal populations
All expected frequencies are 1 or greater
Simple random sample
Expert Solution
This question has been solved!
Explore an expertly crafted, step-by-step solution for a thorough understanding of key concepts.
This is a popular solution!
Trending now
This is a popular solution!
Step by step
Solved in 2 steps with 3 images

Follow-up Questions
Read through expert solutions to related follow-up questions below.
Follow-up Question
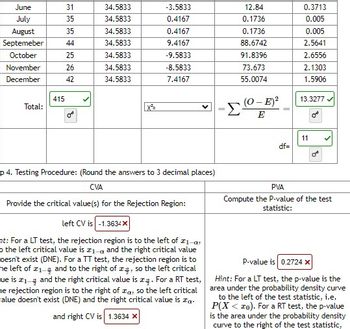
What would the left and right critical values be? Also, it says your p-value answer is incorrect. Not sure if it is your calculations or just the program my professor is using.

Transcribed Image Text:June
July
August
35
Septemeber 44
October
25
26
42
November
December
Total:
415
31
35
34.5833
34.5833
34.5833
34.5833
34.5833
34.5833
34.5833
-3.5833
0.4167
0.4167
9.4167
-9.5833
-8.5833
7.4167
p 4. Testing Procedure: (Round the answers to 3 decimal places)
CVA
Provide the critical value(s) for the Rejection Region:
left CV is -1.3634x
nt: For a LT test, the rejection region is to the left of 21-a
o the left critical value is 21-a and the right critical value
oesn't exist (DNE). For a TT test, the rejection region is to
he left of 1- and to the right of , so the left critical
ue is ₁-# and the right critical value is . For a RT test,
he rejection region is to the right of a, so the left critical
value doesn't exist (DNE) and the right critical value is zo.
and right CV is 1.3634 X
=
12.84
0.1736
0.1736
88.6742
91.8396
73.673
55.0074
(O - E)²
Σ E
df=
0.3713
0.005
0.005
2.5641
2.6556
2.1303
1.5906
13.3277
11
OF
09
PVA
Compute the P-value of the test
statistic:
P-value is 0.2724 Xx
Hint: For a LT test, the p-value is the
area under the probability density curve
to the left of the test statistic, i.e.
P(X<zo). For a RT test, the p-value
is the area under the probability density
curve to the right of the test statistic,
Solution
Recommended textbooks for you

MATLAB: An Introduction with Applications
Statistics
ISBN:
9781119256830
Author:
Amos Gilat
Publisher:
John Wiley & Sons Inc

Probability and Statistics for Engineering and th…
Statistics
ISBN:
9781305251809
Author:
Jay L. Devore
Publisher:
Cengage Learning

Statistics for The Behavioral Sciences (MindTap C…
Statistics
ISBN:
9781305504912
Author:
Frederick J Gravetter, Larry B. Wallnau
Publisher:
Cengage Learning

MATLAB: An Introduction with Applications
Statistics
ISBN:
9781119256830
Author:
Amos Gilat
Publisher:
John Wiley & Sons Inc

Probability and Statistics for Engineering and th…
Statistics
ISBN:
9781305251809
Author:
Jay L. Devore
Publisher:
Cengage Learning

Statistics for The Behavioral Sciences (MindTap C…
Statistics
ISBN:
9781305504912
Author:
Frederick J Gravetter, Larry B. Wallnau
Publisher:
Cengage Learning

Elementary Statistics: Picturing the World (7th E…
Statistics
ISBN:
9780134683416
Author:
Ron Larson, Betsy Farber
Publisher:
PEARSON

The Basic Practice of Statistics
Statistics
ISBN:
9781319042578
Author:
David S. Moore, William I. Notz, Michael A. Fligner
Publisher:
W. H. Freeman

Introduction to the Practice of Statistics
Statistics
ISBN:
9781319013387
Author:
David S. Moore, George P. McCabe, Bruce A. Craig
Publisher:
W. H. Freeman