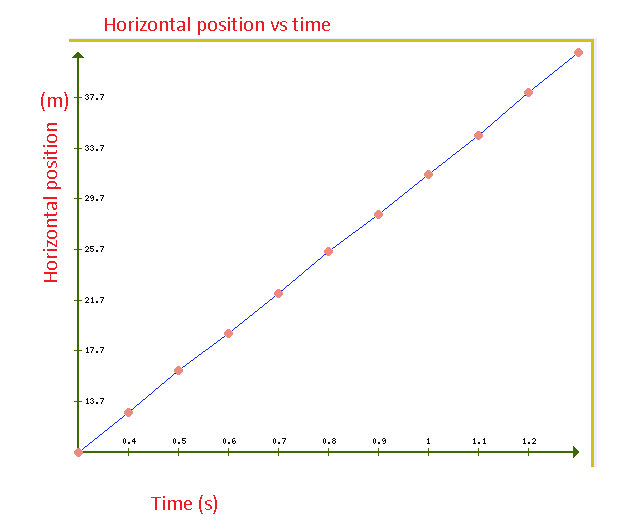
Identify each part of your answer as C, E, and R. Describe the horizontal direction of motion of the puck based on the horizontal direction position-time graph. Does this match what we expect in projectile motion? (Make sure to directly relate your answer to the graph. How does the graph provide us with this information?) Hint: Does the graph show a horizontal direction acceleration? Is the horizontal direction velocity constant? C= Claim that directly answers the question. (No explanations.) E = Evidence (What is the evidence on your graph that supports your claim?) R = (Is this what is expected based on theory? What does theory tell us to expect? Use your reasoning to explain why your evidence supports your claim.)
Identify each part of your answer as C, E, and R. Describe the horizontal direction of motion of the puck based on the horizontal direction position-time graph. Does this match what we expect in projectile motion? (Make sure to directly relate your answer to the graph. How does the graph provide us with this information?) Hint: Does the graph show a horizontal direction acceleration? Is the horizontal direction velocity constant? C= Claim that directly answers the question. (No explanations.) E = Evidence (What is the evidence on your graph that supports your claim?) R = (Is this what is expected based on theory? What does theory tell us to expect? Use your reasoning to explain why your evidence supports your claim.)
Related questions
Question
USE CER to answer this question. Identify each part of your answer as C, E, and R. Describe the horizontal direction of motion of
the puck based on the horizontal direction position-time graph. Does this match what we expect in projectile motion? (Make sure
to directly relate your answer to the graph. How does the graph provide us with this information?)
Hint: Does the graph show a horizontal direction acceleration? Is the horizontal direction velocity constant?
C= Claim that directly answers the question. (No explanations.)
E = Evidence (What is the evidence on your graph that supports your claim?)
R = (Is this what is expected based on theory? What does theory tell us to expect? Use your reasoning to explain why your
evidence supports your claim.)

Transcribed Image Text:R
!
1
10.
F1
Q
A
N
4
5
2
6
@
7
Y
8
m
9
10
>
11
12
13
14
30:
F2
W
S
www
www
***
***
***
***
***
***
www
***
www
S
X
0.3000
0.4000
0.5000
0.6000
0.7000
0.8000
0.9000
1.0000
1.1000
1.2000
#
3
1.3000
20
F3
E
D
t
$
4
C
000
000
F4
R
cm
9.7
12.8
16.1
19.1
22.2
25.5
28.5
31.6
34.7
38.1
41.3
LL
F
%
5
F5
T
V
X
S
6
G
4.1
29.1
cm
28.0
31.1
32.7
25.3
19.3
12.3
23.1
33.1
31.9
F6
MacBook Air
Y
B
&
V
7
H
F7
Y
*
U
8
F8
N
(
10
9
DA
F
M
C
K

Transcribed Image Text:esc
S
!
1
A
P
3. Use this data table and graph to plot horizontal and vertical position vs time graphs for the motion of the puck. You want
to use 0.1000 second time intervals as provided. Remember to measure the position of the center of the puck.
Note that since we're not doing any calculations with our values, you can leave your position measurements in cm.
Hint: You can plot both sets of position data on the graph by entering both columns in the y-axis by following the steps below:
1. Click the vertical axis label.
N
4
5
6
2
7
8
2. Enter your Horizontal Position in one Data Column and your Vertical Position in the other. Apply the measurement ru
when taking data!
3. Keep track of which color represents which set of data!
o
9
10
11
R
F2
****
W
***
S
www 0.4000
...
***
***
time
m
S
0.3000
0.5000
0.6000
0.7000
0.8000
0.9000
1.0000
#
X
3
ge
option command
20
F3
E
t
D
$
4
**
C
888
F4
Horizontal Position (em) Vertical Position (cm)..
cm
9.7
12.8
16.1
19.1
22.2
25.5
28.5
31.6
R
F
%
5
X
F5
T
V
^
6
cm
G
23.1
28.0
31.1
32.7
33.1
31.9
29.1
25.3
MacBook Air
F6
Y
Y
B
7
H
F7
U
*
00
8
N
J
FB
1
(
9
FO
K
M
)
C
O
F10
L
<
I
ge
P
comm
Expert Solution
Step 1

Step by step
Solved in 3 steps with 2 images
