I still do not understand what you calculated to get the 0.05 and that column??? How did you come up with 0.5 and that column? Sorry.... Consider the following table for the necessary calculations. x p xp x2p 1 0.03 0.03 0.05 2 0.1 0.2 0.36 3 0.13 0.39 0.27 4 0.46 1.84 6.72 5 0.28 1.4 10.25 Total 1 3.86 15.96


Contingency Table
A contingency table can be defined as the visual representation of the relationship between two or more categorical variables that can be evaluated and registered. It is a categorical version of the scatterplot, which is used to investigate the linear relationship between two variables. A contingency table is indeed a type of frequency distribution table that displays two variables at the same time.
Binomial Distribution
Binomial is an algebraic expression of the sum or the difference of two terms. Before knowing about binomial distribution, we must know about the binomial theorem.
I still do not understand what you calculated to get the 0.05 and that column??? How did you come up with 0.5 and that column? Sorry....
Consider the following table for the necessary calculations.
|
x |
p |
xp |
x2p |
|
1 |
0.03 |
0.03 |
0.05 |
|
2 |
0.1 |
0.2 |
0.36 |
|
3 |
0.13 |
0.39 |
0.27 |
|
4 |
0.46 |
1.84 |
6.72 |
|
5 |
0.28 |
1.4 |
10.25 |
|
Total |
1 |
3.86 |
15.96 |
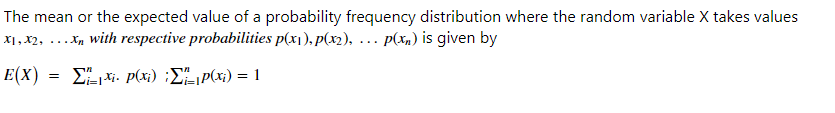
The above table is usually constructed for calculating mean and variance of a random variable X
Mean is the expected value of the random variable given by :
and var(X) = E[X]2-{E(X)}2
=

Step by step
Solved in 2 steps with 1 images


