how to I solve a using single linear Regression in excel or any excel method? I am struggling to understand this question. Can please be very detailed about it, how you were able to do so and what you used to get these answers. I struggle to understand how to answer to this question below. An agent for a real estate company in a suburb has the business objective of developing more accurate estimates of the monthly rental cost for apartments. The agent would like to use the size of an apartment, as defined by square footage to predict the monthly rental cost. The agent collects data from a sample of 30 one-bedroom apartments. a. Construct a 95% confidence interval estimate of the mea


how to I solve a using single linear Regression in excel or any excel method? I am struggling to understand this question. Can please be very detailed about it, how you were able to do so and what you used to get these answers. I struggle to understand how to answer to this question below.
An agent for a real estate company in a suburb has the business objective of developing more accurate estimates of the monthly rental cost for apartments. The agent would like to use the size of an apartment, as defined by square footage to predict the monthly rental cost. The agent collects data from a sample of 30 one-bedroom apartments.

Formula:
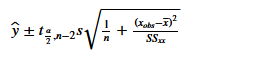
Let X be the size and Y be the rent.
Excel Procedure:
- Enter X and Y data in Excel
- Go to Data
- Click on Data Analysis> ‘Regression’.
- Select Y under ‘Input Y Range’.
- Select X under ‘Input X Range’.
- Click on ‘OK’.
Output:
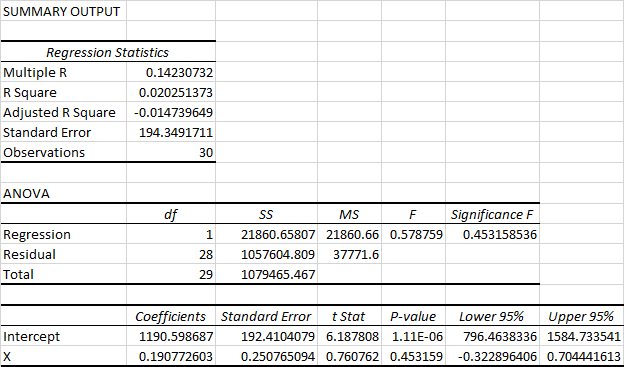
From the given output,
Y=1190.5987+0.1908X.
X=180 square feet
Y^=1190.5987+(0.1908*180)=1224.943

Step by step
Solved in 2 steps with 3 images


