the brain, which can be viewed using PET imaging. The radiotracer has a reported half-life of 14 hours, where its radioactivity will be below detection threshold. A random sample of 40 solutions of the dye is made up at the same concentration and their specific activities measured by a scintillation counter. The average half-life of these dyes is 14.3 hours. Assume that half-life is normally distributed with a standard deviation of 0.58 hours. Is there evidence to support the claim that the mean half-life exceeds 14 hours? Use a 5% level of significance.   Your answer should include:  State the statistical hypotheses (using

MATLAB: An Introduction with Applications
6th Edition
ISBN:9781119256830
Author:Amos Gilat
Publisher:Amos Gilat
Chapter1: Starting With Matlab
Section: Chapter Questions
Problem 1P
icon
Related questions
Question
100%

Medical researchers have developed a radiotracer dye that can bind to specific dopaminergic cell receptor sites in the brain, which can be viewed using PET imaging. The radiotracer has a reported half-life of 14 hours, where its radioactivity will be below detection threshold. A random sample of 40 solutions of the dye is made up at the same concentration and their specific activities measured by a scintillation counter. The average half-life of these dyes is 14.3 hours. Assume that half-life is normally distributed with a standard deviation of 0.58 hours. Is there evidence to support the claim that the mean half-life exceeds 14 hours? Use a 5% level of significance.


Your answer should include:

 State the statistical hypotheses (using the appropriate notation).

 Indicate whether the alternative hypothesis is non-directional or directional (and how you know).

 Set the decision rules, which will include:

o State alpha

o Providing the critical value for the test statistic

o Sketch the curve and label the rejection region

o State the decision rules using the critical value approach

 Calculate the test statistic

 Draw a conclusion (state whether H0 is rejected or not and why you made this decision).

 Interpret the result.

Expert Solution
steps

Step by step

Solved in 2 steps with 2 images

Blurred answer
Follow-up Questions
Read through expert solutions to related follow-up questions below.
Follow-up Question

How did you find the critical Value in regards to my z Table? If you could help me with figuring this out, I would appreciate it as I want to practice this as much as possible and learn how to do it well! Included is my Z table and T table from my textbook that goes with question - forgot to include. 

Thank you in advance 
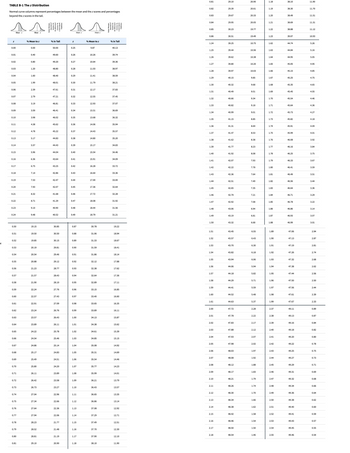
"
TABLE B-1 The z Distribution
Normal curve columns represent percentages between the mean and the z scores and percentages
beyond the z scores in the tail.
Z
0.00
0.01
0.02
0.03
0.04
0.05
0.06
0.07
0.08
0.09
0.10
0.11
0.12
Mean z
0.13
0.14
0.15
0.16
0.17
0.18
0.19
0.20
0.21
0.22
0.23
0.24
0.50
0.51
0.52
0.53
0.54
0.55
0.56
0.57
0.58
0.59
0.60
0.61
0.62
0.63
0.64
0.65
0.66
0.67
0.68
0.69
0.70
0.71
0.72
0.73
0.74
0.75
0.76
0.77
0.78
0.79
0.80
0.81
Mean z
% Mean to z
0.00
0.40
0.80
1.20
1.60
1.99
2.39
2.79
3.19
3.59
3.98
4.38
4.78
5.17
5.57
5.96
6.36
6.75
7.14
7.53
7.93
8.32
8.71
9.10
9.48
19.15
19.50
19.85
20.19
20.54
20.88
21.23
21.57
21.90
22.24
22.57
22.91
23.24
23.57
23.89
24.22
24.54
24.86
25.17
25.49
25.80
26.11
26.42
26.73
27.04
27.34
27.64
27.94
28.23
28.52
28.81
29.10
lil
% in Tail
50.00
49.60
49.20
48.80
48.40
48.01
47.61
47.21
46.81
46.41
46.02
45.62
45.22
44.83
44.43
44.04
43.64
43.25
42.86
42.47
42.07
41.68
41.29
40.90
40.52
30.85
30.50
30.15
29.81
29.46
29.12
28.77
28.43
28.10
27.76
27.43
27.09
26.76
26.43
26.11
25.78
25.46
25.14
24.83
24.51
24.20
23.89
23.58
23.27
22.96
22.66
22.36
22.06
21.77
21.48
21.19
20.90
Л
Z
0.25
0.26
0.27
0.28
0.29
0.30
0.31
0.32
0.33
0.34
0.35
0.36
0.37
0.38
0.39
0.40
0.41
0.42
0.43
0.44
0.45
0.46
0.47
0.48
0.49
Mean z
0.87
0.88
0.89
0.90
0.91
0.92
0.93
0.94
0.95
0.96
0.97
0.98
0.99
1.00
1.01
1.02
1.03
1.04
1.05
1.06
1.07
1.08
1.09
1.10
1.11
1.12
1.13
1.14
1.15
1.16
1.17
1.18
s
Mean z
% Mean to z
9.87
10.26
10.64
11.03
11.41
11.79
12.17
12.55
12.93
13.31
13.68
14.06
14.43
14.80
15.17
15.54
15.91
16.28
16.64
17.00
17.36
17.72
18.08
18.44
18.79
30.78
31.06
31.33
31.59
31.86
32.12
32.38
32.64
32.89
33.15
33.40
33.65
33.89
34.13
34.38
34.61
34.85
35.08
35.31
35.54
35.77
35.99
36.21
36.43
36.65
36.86
37.08
37.29
37.49
37.70
37.90
38.10
% in Tail
40.13
39.74
39.36
38.97
38.59
38.21
37.83
37.45
37.07
36.69
36.32
35.94
35.57
35.20
34.83
34.46
34.09
33.72
33.36
33.00
32.64
32.28
31.92
31.56
31.21
19.22
18.94
18.67
18.41
18.14
17.88
17.62
17.36
17.11
16.85
16.60
16.35
16.11
15.87
15.62
15.39
15.15
14.92
14.69
14.46
14.23
14.01
13.79
13.57
13.35
13.14
12.92
12.71
12.51
12.30
12.10
11.90
0.81
0.82
0.83
0.84
0.85
0.86
1.24
1.25
1.26
1.27
1.28
1.29
1.30
1.31
1.32
1.33
1.34
1.35
1.36
1.37
1.38
1.39
1.40
1.41
1.42
1.43
1.44
1.45
1.46
1.47
1.48
1.49
1.50
1.51
1.52
1.53
1.54
1.55
1.56
1.57
1.58
1.59
1.60
1.61
2.00
2.01
2.02
2.03
2.04
2.05
2.06
2.07
2.08
2.09
2.10
2.11
2.12
2.13
2.14
2.15
2.16
2.17
2.18
29.10
29.39
29.67
29.95
30.23
30.51
39.25
39.44
39.62
39.80
39.97
40.15
40.32
40.49
40.66
40.82
40.99
41.15
41.31
41.47
41.62
41.77
41.92
42.07
42.22
42.36
42.51
42.65
42.79
42.92
43.06
43.19
43.32
43.45
43.57
43.70
43.82
43.94
44.06
44.18
44.29
44.41
44.52
44.63
47.72
47.78
47.83
47.88
47.93
47.98
48.03
48.08
48.12
48.17
48.21
48.26
48.30
48.34
48.38
48.42
48.46
48.50
48.54
20.90
20.61
20.33
20.05
19.77
19.49
10.75
10.56
10.38
10.20
10.03
9.85
9.68
9.51
9.34
9.18
9.01
8.85
8.69
8.53
8.38
8.23
8.08
7.93
7.78
7.64
7.49
7.35
7.21
7.08
6.94
6.81
6.68
6.55
6.43
6.30
6.18
6.06
5.94
5.82
5.71
5.59
5.48
5.37
2.28
2.22
2.17
2.12
2.07
2.02
1.97
1.92
1.88
1.83
1.79
1.74
1.70
1.66
1.62
1.58
1.54
1.50
1.46
1.18
1.19
1.20
1.21
1.22
1.23
1.62
1.63
1.64
1.65
1.66
1.67
1.68
1.69
1.70
1.71
1.72
1.73
1.74
1.75
1.76
1.77
1.78
1.79
1.80
1.81
1.82
1.83
1.84
1.85
1.86
1.87
1.88
1.89
1.90
1.91
1.92
1.93
1.94
1.95
1.96
1.97
1.98
1.99
2.37
2.38
2.39
2.40
2.41
2.42
2.43
2.44
2.45
2.46
2.47
2.48
2.49
2.50
2.51
2.52
2.53
2.54
2.55
38.10
38.30
38.49
38.69
38.88
39.07
44.74
44.84
44.95
45.05
45.15
45.25
45.35
45.45
45.54
45.64
45.73
45.82
45.91
45.99
46.08
46.16
46.25
46.33
46.41
46.49
46.56
46.64
46.71
46.78
46.86
46.93
46.99
47.06
47.13
47.19
47.26
47.32
47.38
47.44
47.50
47.56
47.61
47.67
49.11
49.13
49.16
49.18
49.20
49.22
49.25
49.27
49.29
49.31
49.32
49.34
49.36
49.38
49.40
49.41
49.43
49.45
49.46
11.90
11.70
11.51
11.31
11.12
10.93
5.26
5.16
5.05
4.95
4.85
4.75
4.65
4.55
4.46
4.36
4.27
4.18
4.09
4.01
3.92
3.84
3.75
3.67
3.59
3.51
3.44
3.36
3.29
3.22
3.14
3.07
3.01
2.94
2.87
2.81
2.74
2.68
2.62
2.56
2.50
2.44
2.39
2.33
0.89
0.87
0.84
0.82
0.80
0.78
0.75
0.73
0.71
0.69
0.68
0.66
0.64
0.62
0.60
0.59
0.57
0.55
0.54
Transcribed Image Text:" TABLE B-1 The z Distribution Normal curve columns represent percentages between the mean and the z scores and percentages beyond the z scores in the tail. Z 0.00 0.01 0.02 0.03 0.04 0.05 0.06 0.07 0.08 0.09 0.10 0.11 0.12 Mean z 0.13 0.14 0.15 0.16 0.17 0.18 0.19 0.20 0.21 0.22 0.23 0.24 0.50 0.51 0.52 0.53 0.54 0.55 0.56 0.57 0.58 0.59 0.60 0.61 0.62 0.63 0.64 0.65 0.66 0.67 0.68 0.69 0.70 0.71 0.72 0.73 0.74 0.75 0.76 0.77 0.78 0.79 0.80 0.81 Mean z % Mean to z 0.00 0.40 0.80 1.20 1.60 1.99 2.39 2.79 3.19 3.59 3.98 4.38 4.78 5.17 5.57 5.96 6.36 6.75 7.14 7.53 7.93 8.32 8.71 9.10 9.48 19.15 19.50 19.85 20.19 20.54 20.88 21.23 21.57 21.90 22.24 22.57 22.91 23.24 23.57 23.89 24.22 24.54 24.86 25.17 25.49 25.80 26.11 26.42 26.73 27.04 27.34 27.64 27.94 28.23 28.52 28.81 29.10 lil % in Tail 50.00 49.60 49.20 48.80 48.40 48.01 47.61 47.21 46.81 46.41 46.02 45.62 45.22 44.83 44.43 44.04 43.64 43.25 42.86 42.47 42.07 41.68 41.29 40.90 40.52 30.85 30.50 30.15 29.81 29.46 29.12 28.77 28.43 28.10 27.76 27.43 27.09 26.76 26.43 26.11 25.78 25.46 25.14 24.83 24.51 24.20 23.89 23.58 23.27 22.96 22.66 22.36 22.06 21.77 21.48 21.19 20.90 Л Z 0.25 0.26 0.27 0.28 0.29 0.30 0.31 0.32 0.33 0.34 0.35 0.36 0.37 0.38 0.39 0.40 0.41 0.42 0.43 0.44 0.45 0.46 0.47 0.48 0.49 Mean z 0.87 0.88 0.89 0.90 0.91 0.92 0.93 0.94 0.95 0.96 0.97 0.98 0.99 1.00 1.01 1.02 1.03 1.04 1.05 1.06 1.07 1.08 1.09 1.10 1.11 1.12 1.13 1.14 1.15 1.16 1.17 1.18 s Mean z % Mean to z 9.87 10.26 10.64 11.03 11.41 11.79 12.17 12.55 12.93 13.31 13.68 14.06 14.43 14.80 15.17 15.54 15.91 16.28 16.64 17.00 17.36 17.72 18.08 18.44 18.79 30.78 31.06 31.33 31.59 31.86 32.12 32.38 32.64 32.89 33.15 33.40 33.65 33.89 34.13 34.38 34.61 34.85 35.08 35.31 35.54 35.77 35.99 36.21 36.43 36.65 36.86 37.08 37.29 37.49 37.70 37.90 38.10 % in Tail 40.13 39.74 39.36 38.97 38.59 38.21 37.83 37.45 37.07 36.69 36.32 35.94 35.57 35.20 34.83 34.46 34.09 33.72 33.36 33.00 32.64 32.28 31.92 31.56 31.21 19.22 18.94 18.67 18.41 18.14 17.88 17.62 17.36 17.11 16.85 16.60 16.35 16.11 15.87 15.62 15.39 15.15 14.92 14.69 14.46 14.23 14.01 13.79 13.57 13.35 13.14 12.92 12.71 12.51 12.30 12.10 11.90 0.81 0.82 0.83 0.84 0.85 0.86 1.24 1.25 1.26 1.27 1.28 1.29 1.30 1.31 1.32 1.33 1.34 1.35 1.36 1.37 1.38 1.39 1.40 1.41 1.42 1.43 1.44 1.45 1.46 1.47 1.48 1.49 1.50 1.51 1.52 1.53 1.54 1.55 1.56 1.57 1.58 1.59 1.60 1.61 2.00 2.01 2.02 2.03 2.04 2.05 2.06 2.07 2.08 2.09 2.10 2.11 2.12 2.13 2.14 2.15 2.16 2.17 2.18 29.10 29.39 29.67 29.95 30.23 30.51 39.25 39.44 39.62 39.80 39.97 40.15 40.32 40.49 40.66 40.82 40.99 41.15 41.31 41.47 41.62 41.77 41.92 42.07 42.22 42.36 42.51 42.65 42.79 42.92 43.06 43.19 43.32 43.45 43.57 43.70 43.82 43.94 44.06 44.18 44.29 44.41 44.52 44.63 47.72 47.78 47.83 47.88 47.93 47.98 48.03 48.08 48.12 48.17 48.21 48.26 48.30 48.34 48.38 48.42 48.46 48.50 48.54 20.90 20.61 20.33 20.05 19.77 19.49 10.75 10.56 10.38 10.20 10.03 9.85 9.68 9.51 9.34 9.18 9.01 8.85 8.69 8.53 8.38 8.23 8.08 7.93 7.78 7.64 7.49 7.35 7.21 7.08 6.94 6.81 6.68 6.55 6.43 6.30 6.18 6.06 5.94 5.82 5.71 5.59 5.48 5.37 2.28 2.22 2.17 2.12 2.07 2.02 1.97 1.92 1.88 1.83 1.79 1.74 1.70 1.66 1.62 1.58 1.54 1.50 1.46 1.18 1.19 1.20 1.21 1.22 1.23 1.62 1.63 1.64 1.65 1.66 1.67 1.68 1.69 1.70 1.71 1.72 1.73 1.74 1.75 1.76 1.77 1.78 1.79 1.80 1.81 1.82 1.83 1.84 1.85 1.86 1.87 1.88 1.89 1.90 1.91 1.92 1.93 1.94 1.95 1.96 1.97 1.98 1.99 2.37 2.38 2.39 2.40 2.41 2.42 2.43 2.44 2.45 2.46 2.47 2.48 2.49 2.50 2.51 2.52 2.53 2.54 2.55 38.10 38.30 38.49 38.69 38.88 39.07 44.74 44.84 44.95 45.05 45.15 45.25 45.35 45.45 45.54 45.64 45.73 45.82 45.91 45.99 46.08 46.16 46.25 46.33 46.41 46.49 46.56 46.64 46.71 46.78 46.86 46.93 46.99 47.06 47.13 47.19 47.26 47.32 47.38 47.44 47.50 47.56 47.61 47.67 49.11 49.13 49.16 49.18 49.20 49.22 49.25 49.27 49.29 49.31 49.32 49.34 49.36 49.38 49.40 49.41 49.43 49.45 49.46 11.90 11.70 11.51 11.31 11.12 10.93 5.26 5.16 5.05 4.95 4.85 4.75 4.65 4.55 4.46 4.36 4.27 4.18 4.09 4.01 3.92 3.84 3.75 3.67 3.59 3.51 3.44 3.36 3.29 3.22 3.14 3.07 3.01 2.94 2.87 2.81 2.74 2.68 2.62 2.56 2.50 2.44 2.39 2.33 0.89 0.87 0.84 0.82 0.80 0.78 0.75 0.73 0.71 0.69 0.68 0.66 0.64 0.62 0.60 0.59 0.57 0.55 0.54
Solution
Bartleby Expert
SEE SOLUTION
Similar questions
Recommended textbooks for you
MATLAB: An Introduction with Applications
Statistics
ISBN:
9781119256830
Author:
Amos Gilat
Publisher:
John Wiley & Sons Inc
Probability and Statistics for Engineering and th…
Statistics
ISBN:
9781305251809
Author:
Jay L. Devore
Publisher:
Cengage Learning
Statistics for The Behavioral Sciences (MindTap C…
Statistics
ISBN:
9781305504912
Author:
Frederick J Gravetter, Larry B. Wallnau
Publisher:
Cengage Learning
Elementary Statistics: Picturing the World (7th E…
Statistics
ISBN:
9780134683416
Author:
Ron Larson, Betsy Farber
Publisher:
PEARSON
The Basic Practice of Statistics
Statistics
ISBN:
9781319042578
Author:
David S. Moore, William I. Notz, Michael A. Fligner
Publisher:
W. H. Freeman
Introduction to the Practice of Statistics
Statistics
ISBN:
9781319013387
Author:
David S. Moore, George P. McCabe, Bruce A. Craig
Publisher:
W. H. Freeman